Jess Grossman would be the first to tell you your highest order rate is most likely coming from people who have engaged with your brand in the last 30 days.
As an ecommerce veteran and owner of In Social, a Shopify Expert digital marketing agency, Grossman understands the fundamental rules of email marketing engagement better than most—particularly the importance of fresh brand recall for making purchase decisions.
Except Grossman was thrown for a loop when her agency started running email campaigns for restaurants, an industry that hasn’t yet adopted many of the fundamental best practices of direct-to-consumer online sales.
As she widened her audience parameters beyond a 30-day engaged segment, she noticed a surprising trend: Most people who completed an online order had last engaged with email 60-90 days prior.
The lesson for restaurants? Don’t give up on people who haven’t visited your restaurant in 3 months.
“Restaurants haven’t had access to this kind of data because they don’t know that email reporting tools can offer it to them,” Grossman says. “Most restaurateurs assume that if people haven’t engaged with a campaign in 3-4 months, it’s time to let them go and go after people who have engaged within a month or even a week.’
“But I’m seeing data that’s showing high click rates among people who haven’t engaged between 91-180 days,” Grossman explains. “Restaurants shouldn’t ignore these people.”
Bottom line: Email reporting is important.
You can, and should, look beyond open rates and click rates to understand the health of your marketing strategy, your business, and the next steps toward more revenue.
It’s also more complex and nuanced than it used to be. You can, and should, look beyond open rates and click rates to understand the health of your marketing strategy, your business, and the next steps toward more revenue.
After reading this article, you’ll understand:
- How to make the case for granular email reporting for your business
- Attribution windows and why they matter
- The most important email marketing reports for increasing revenue
- How to best set up and view email reporting dashboards
What is email reporting?
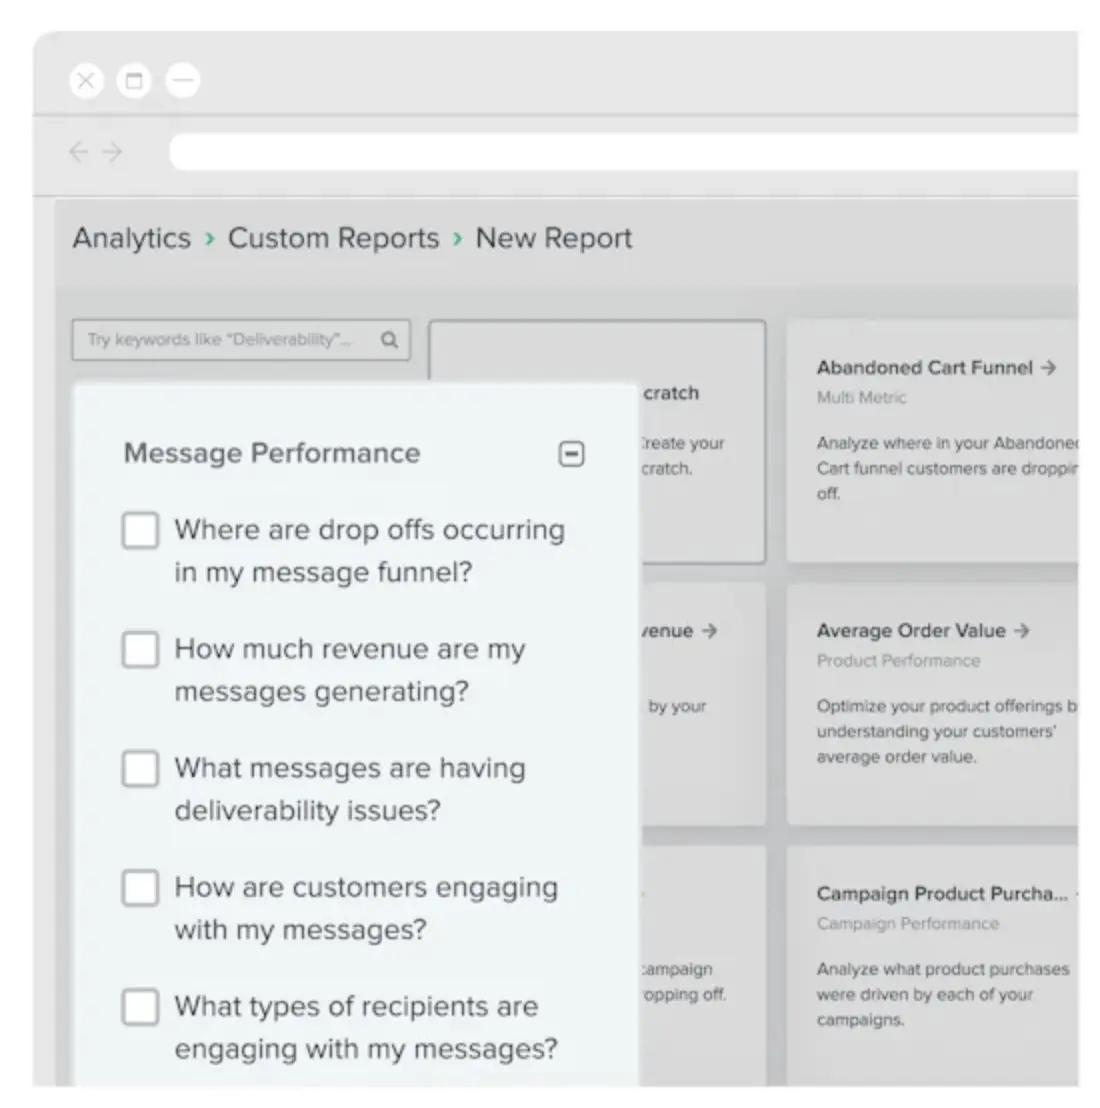
Email reporting condenses email performance data into easy-to-digest visual formats so that businesses can quickly assess whether their email campaigns and automations are effective. Through dashboards that are easy to share and customize, email reporting helps businesses make quick adjustments to marketing campaigns so they can bring in more revenue.
Advanced reporting tools measure more than open rates and clicks, though. Sophisticated reporting platforms aggregate and visualize data from multiple channels, like email, SMS, and your website. Effective email reporting tools demonstrate how your campaigns are performing relative to other channels and internal and external benchmarks, down to the finest detail.
Finally, the best email marketing tools out there make it easy and quick for you to diagnose issues and improve performance and revenue through email marketing, without having to consistently crunch numbers.
Why is email reporting important?
Email reporting is important for increasing revenue.
That may be the gist, but if you need to make the case for a more comprehensive email reporting tool to an executive, here are 3 points to zero in on:
1. Email reporting leads to better resource allocation
Email reporting reveals patterns. Over time, reports clearly indicate the types of email campaigns that are working and which ones are not.
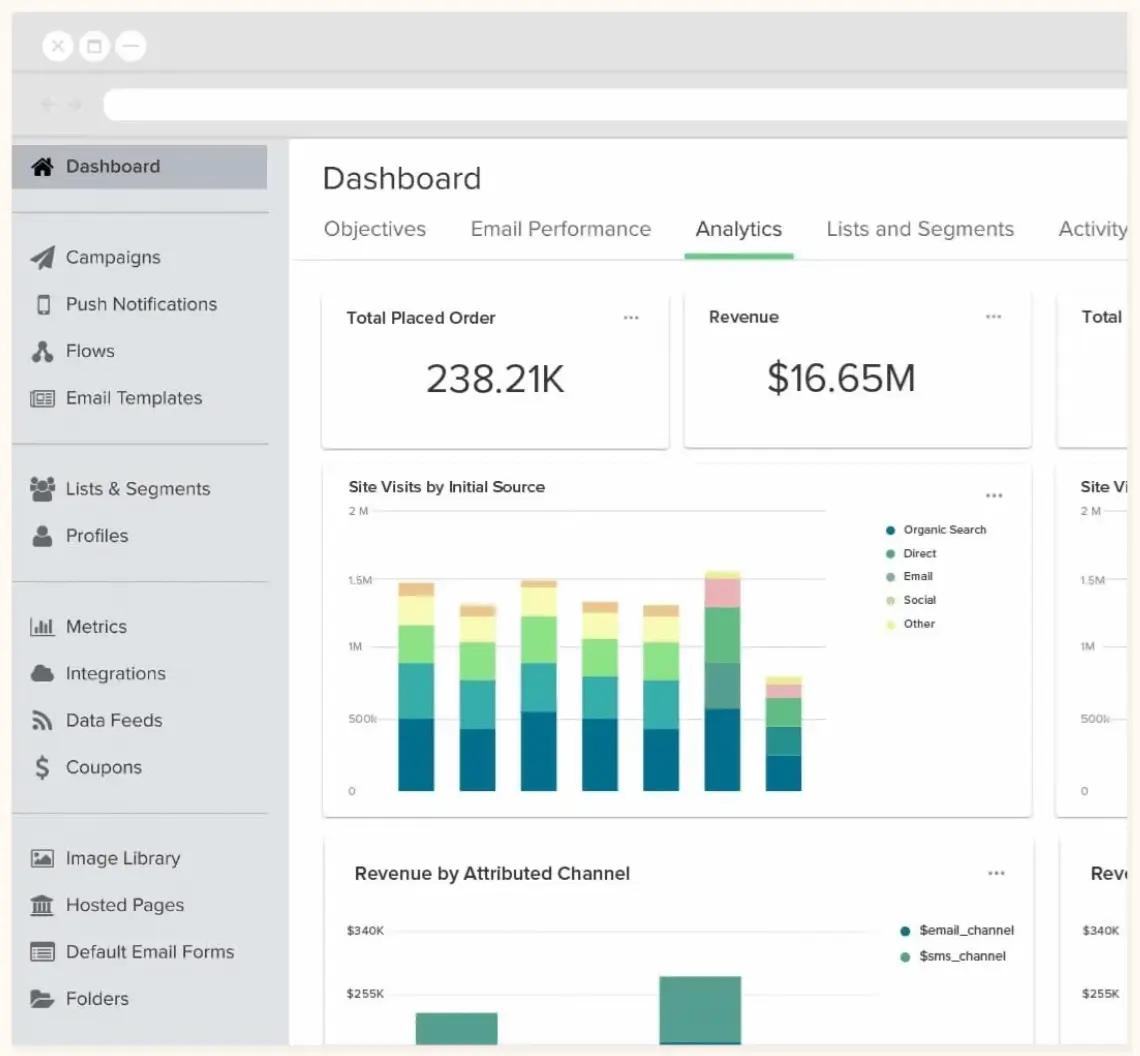
Most important, comprehensive reporting that visualizes your email performance relative to other owned channels like SMS and your website allows you to allocate budget and talent where you’re most likely to see success.
2. Email reporting leads to higher-performing campaigns and automations
Email reports establish benchmarks for future campaigns. Advanced tools let businesses know what’s normal for their industry, so marketing teams understand the numbers they need to knock a campaign out of the park.
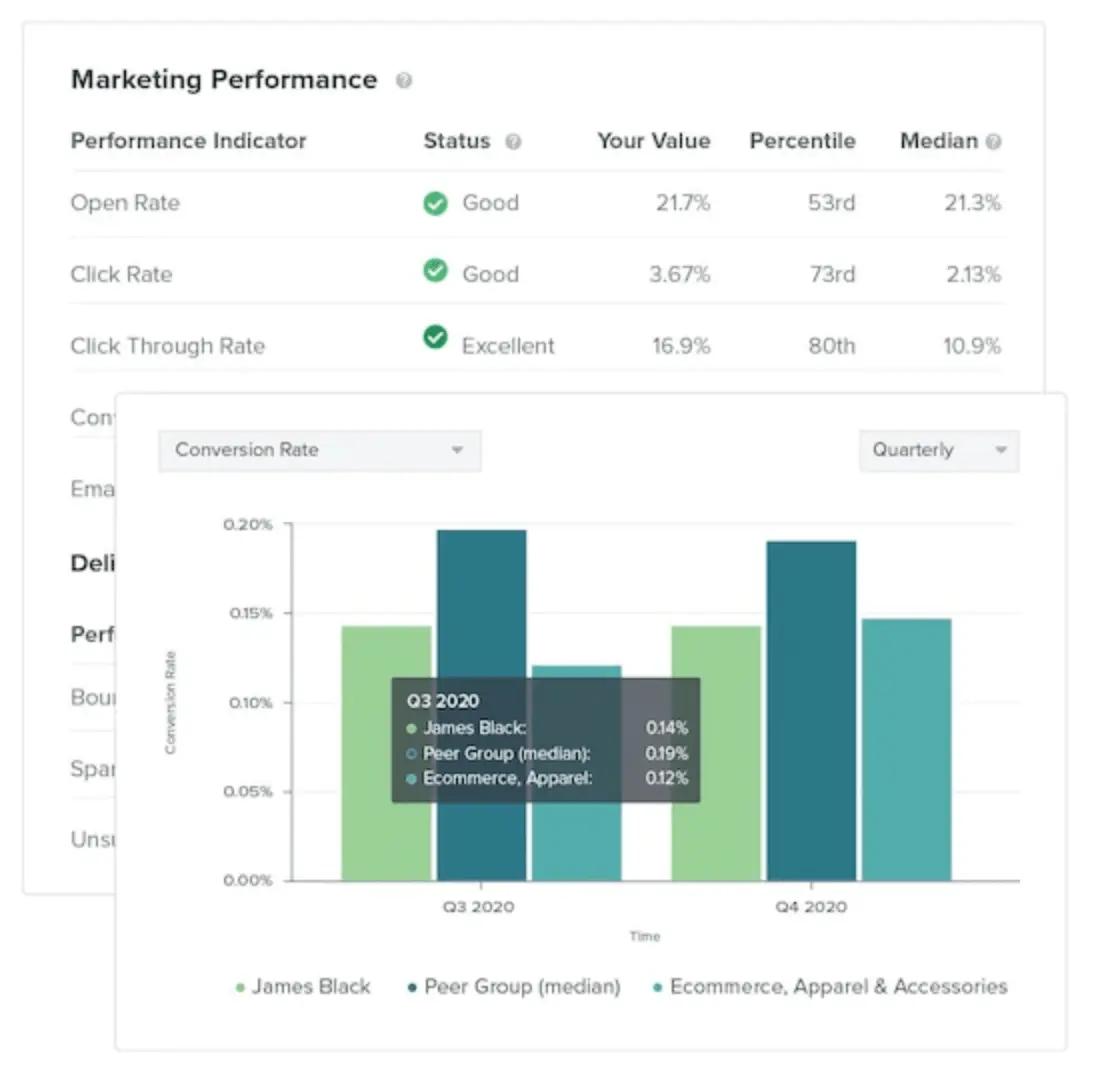
When businesses use email reporting to compare metrics over time, they can set realistic goals—while also making the necessary design, copy, and audience segmentation adjustments to surpass them.
3. Email reporting is your window to audience behavior
Email segmentation is the backbone of a modern, personalized email strategy—the era of blasting your whole list with the same email is gone now that we have Customer-First Data™ that can trigger emails based on behavior.
Email reporting is what allows you to see, in detail, how each of your audience segments are responding to your email strategy.
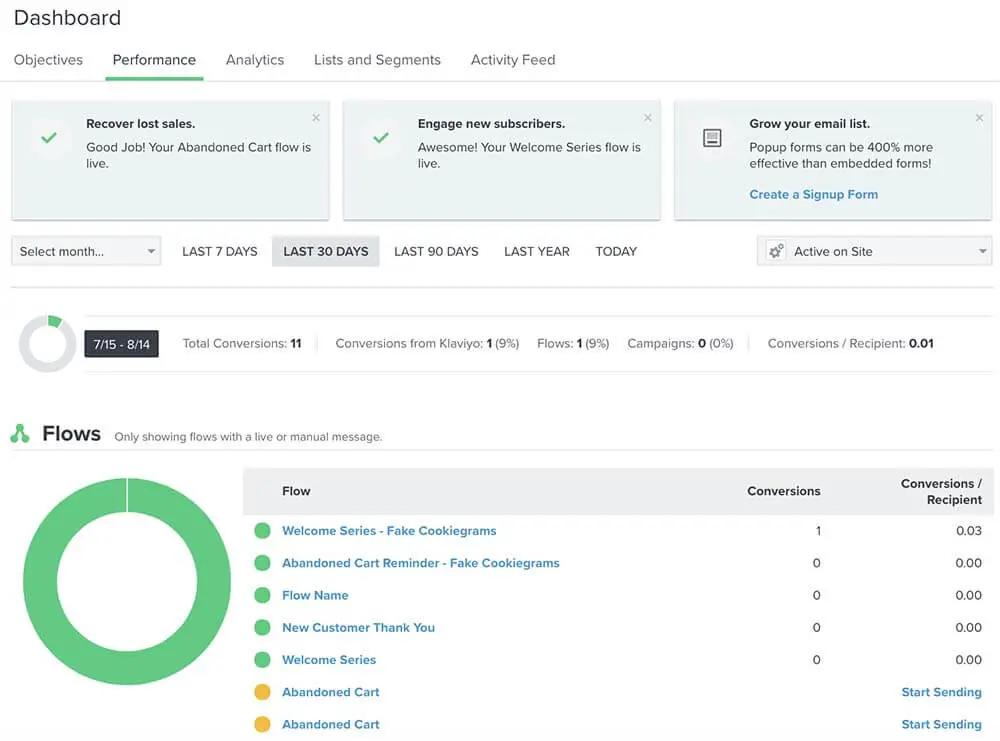
With reports, you can tailor campaigns for specific segments and gain a deeper understanding of your target audience in the process.
Returning to Jess Grossman’s earlier example for restaurants, email reporting can challenge assumptions businesses may have about how their audience behaves and potentially unlock new revenue streams where they least expect it.
Before you set up email reporting: understand attribution windows
An attribution window is the time between the moment someone interacts with a marketing asset and the moment they convert, whether it’s buying a product or signing up on a form.
Attribution is helpful for understanding which marketing channel, or set of channels, gets “credit” for a conversion. With accurate attribution, leadership teams know where revenue is coming from.
But the importance of attribution extends well beyond the potential ego boost or bust of who gets credit.
Attribution is crucial for understanding which parts of your end-to-end marketing strategy are generating revenue—and which ones still need work.
Attribution is crucial for understanding which parts of your end-to-end marketing strategy are generating revenue—and which ones still need work.
Alexa Kilroy, former head of brand at Triple Whale, explains that your ideal attribution model depends on your goals.
“At Triple Whale, we like to use fractional attribution, which divides credit across all touchpoints on your customer’s buying journey,” Kilroy says. “If you’re working on faster buying decisions, for example, you can use a 7- or 14-day attribution window to see who clicked on a Facebook ad, who clicked on an email, and who maybe decided to buy from an SMS message.”
“But you may need longer attribution windows if you’re trying to shorten your entire buyer’s journey,” Kilroy adds.
Where some platforms get into trouble is when they use unrealistic attribution windows to take credit for a conversion.
For example, some automation platforms use a default SMS attribution window of 30 days. But when you think about how someone interacts with their text messages, it seems silly to think anyone is taking action on an SMS message that’s more than a few days old.
Klaviyo, on the other hand, applies a 5- to 7-day default window for email and an even shorter one for SMS (only 24 hours). This is how Klaviyo provides an accurate view of what’s working and what’s not, reflective of how recipients actually interact with email and SMS channels.
Note, however, that attribution windows in Klaviyo are customizable to your business’ specific needs—most marketers opt for one of several multi-touch attribution models, which assign credit to multiple channels that assist with a sale.
5 fundamental email reports for your business
More sophistication in email reporting means more complexity. The complexity is worth it for the increase in campaign performance and revenue, but it can also create some confusion when you’re trying to set up the right reports.
Before you read on about reports, we highly recommend brushing up on your knowledge of fundamental email marketing metrics first. If you feel you have a solid grasp of the basics, you’re ready to learn more about reports.
Here are 5 types to dive into:
1. Email campaign reports
An email marketing campaign is a promotional email, or a series of emails, you send to a specific portion of your email list.
Most of the time, the goal of an email marketing campaign is to increase engagement and conversion on a specific offer.
Email campaign reports visualize the following metrics:
- Click-through rate (CTR): the percentage of recipients who open an email AND click on a link within an email. CTR is no longer a reliable metric for email marketers since Apple’s iOS15 update, which obscures the numbers of real people opening your email. You can get around this with a feature in Klaviyo to exclude iOS email users from your metrics. Or, you can simply use click rate as a far better KPI.
- Click rate: the percentage of recipients who received the email AND clicked on a link within the email
- “Active on site”: website activity after a recipient clicks on an email, such as how much time they spend on your website, which product pages or landing pages they browse, and what they leave in their carts
- Conversion rate: the percentage of recipients who take action after they click on an email
- Revenue per recipient (RPR): the total amount of revenue your email generates divided by total email deliveries
In Klaviyo, this shows up as Rev/Rec on your Email Performance Review and your Campaign Performance Detail views.This allows you to analyze RPR both per campaign and side by side with all your campaigns.- In Klaviyo, this shows up as Rev/Rec on your Email Performance Review and your Campaign Performance Detail views.
- This allows you to analyze RPR both per campaign and side by side with all your campaigns.
- Deliverability rates: the percentage of emails that makes it to your recipients’ inboxes
- Unsubscribe rate: the percentage of people who receive your email and then unsubscribe from your list
A typical email campaign report looks something like this:
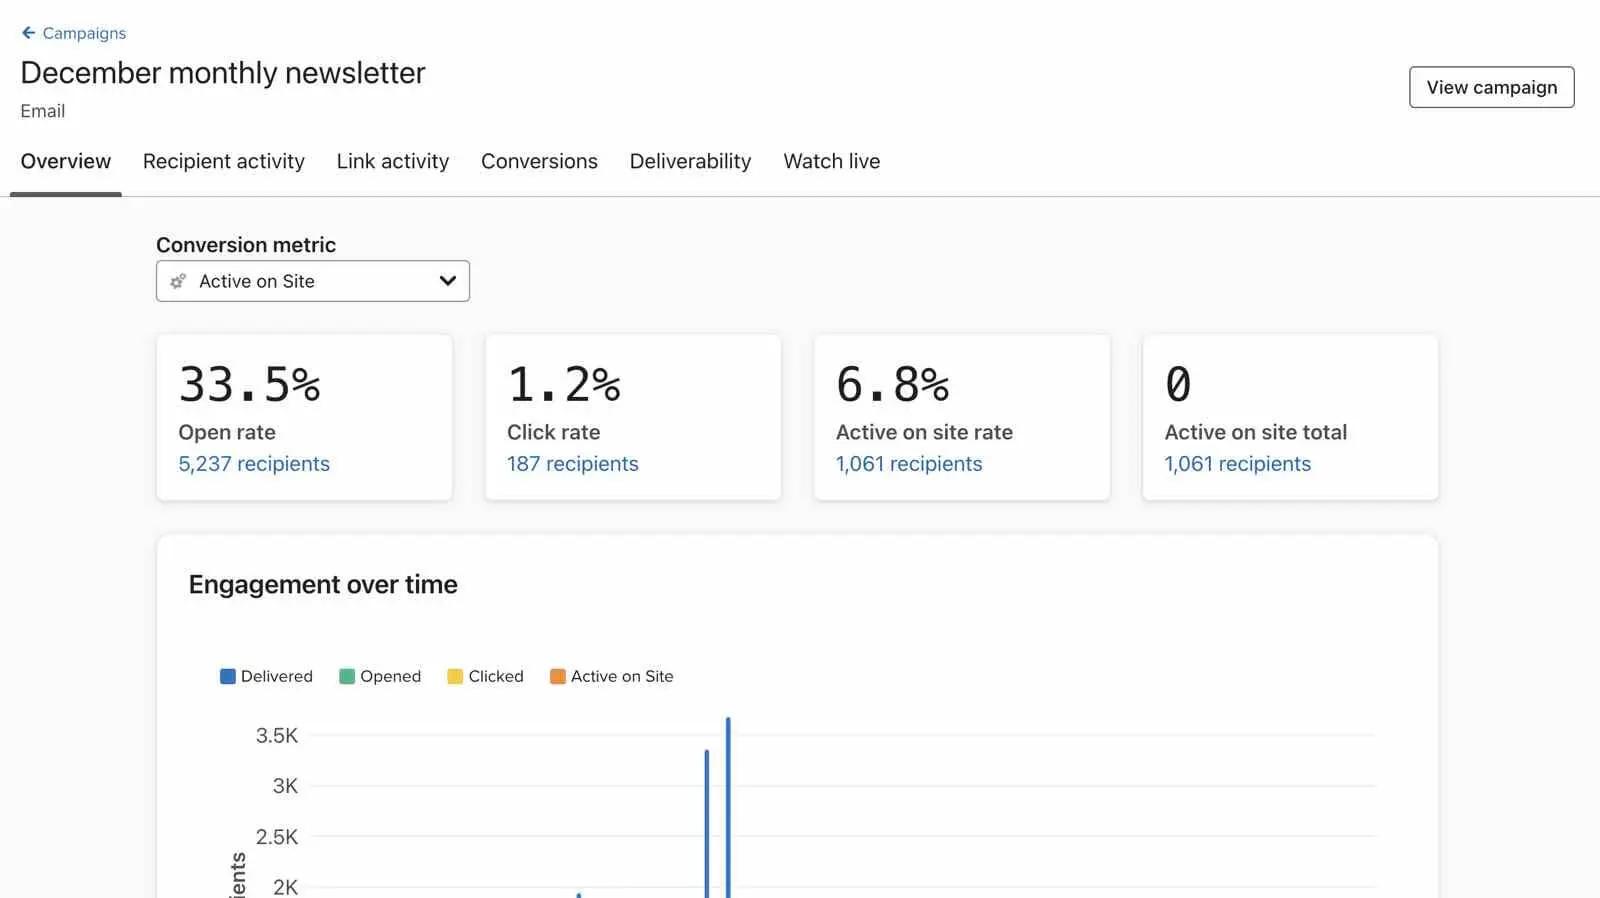
Beyond an overview of the results of your campaigns, an actionable email campaign report offers additional layers of granularity, like:
- Total revenue of the conversions attributed to a campaign
- Open rates and conversions per hour for the entirety of the campaign
- Which links within the email brought in the most conversions
2. Audience segment reports
Audience segment reports, or list reports, let you know how certain portions of your overall email list are performing. These reports essentially break down the engagement level of a group of profiles, which helps you assess their quality and potential to buy.
A typical audience engagement report looks something like this:
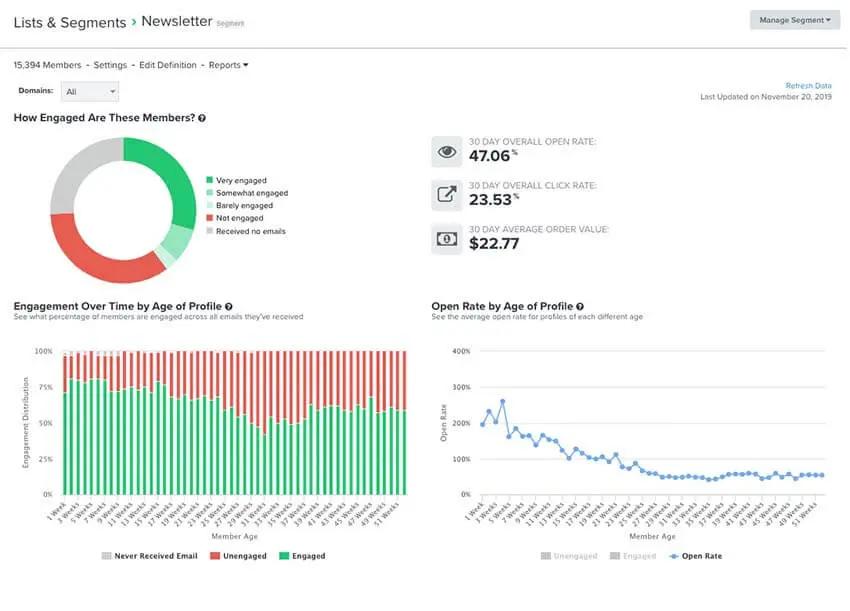
This report is the window to your audience’s soul, and it can tell you the next steps to take with any given segment.
For example:
- If you’re seeing that a lot of people within a segment are highly engaged, it may be time to send them an offer to buy.
- If you’re seeing that most people within a segment aren’t engaged at all, that might be your cue to clean up your list so your overall email deliverability remains healthy.
List reports also let you know how fast your lists are growing, although it’s important to evaluate these reports within the proper context.
Audrey Durand, senior director of digital services at The Stable, stresses that quality over quantity is key: “A lot of our clients think subscriber growth correlates with new customer acquisition, but that’s not always the case.”
This is why list engagement reports are so essential—they tell you whether your list building efforts are likely to turn into actual revenue.
3. Email automation reports
Email marketing automation is a set of messages sent to people at scale, typically according to common online behaviors like subscribing to a list or browsing a website.
Automation technology is what allows you to build personalized content and rules around which emails go out, and when—without manually adding people to a recipient list or pressing send.
These emails are important because they make you money while you sleep, so you’ll want to scrutinize their performance closely.
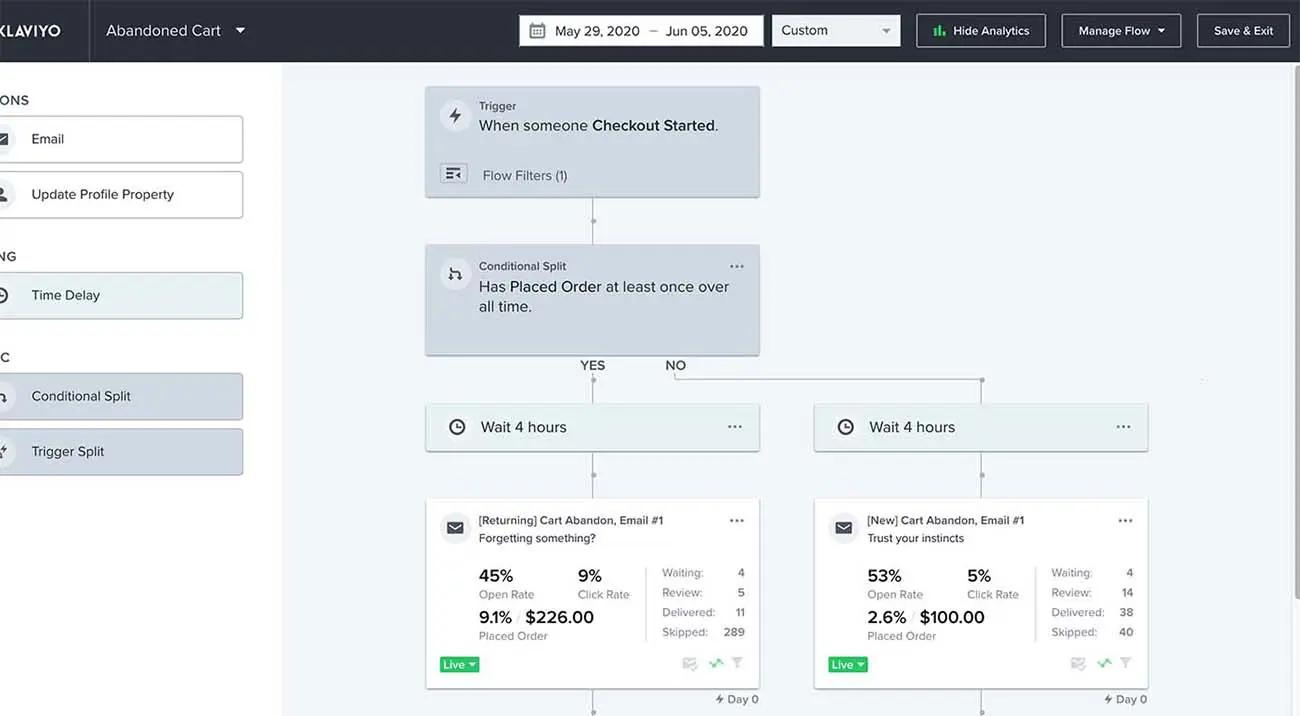
This is an example of a flow analytics report for an abandoned cart flow. You can see from the report that if someone has purchased a product before, the email they receive has an overall click rate of 9% and an order value of $226, compared to a 5% click rate and an order value of $100 for people who haven’t purchased.
4. Cross-channel benchmark reports
If you’re not part of an agency and your work is limited to one brand, you probably wonder whether your email performance is normal, good, or bad compared to other brands like yours.
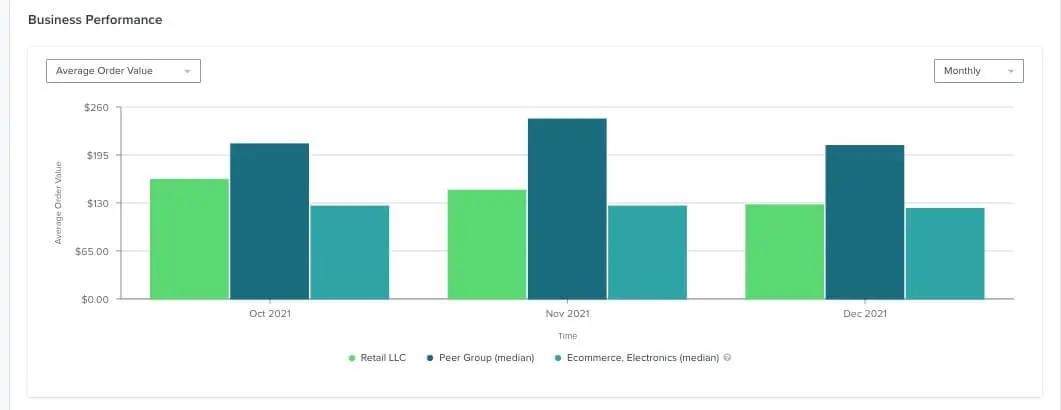
Cross-channel benchmark reports answer these questions. With anonymized data, advanced email reporting platforms can aggregate results within your product category and peer group to let you know how you’re performing in the following areas:
- Business performance
- Email campaigns
- SMS campaigns
- Automations, or flows
This report demonstrates average order value performance on a monthly basis, comparing one business to a close peer group and wider industry norms. Solid reporting platforms allow teams to isolate the metric they want to assess within a variety of time frames.
5. Deliverability reports
Deliverability reports are often overlooked, but they’re some of your most important reports for the overall health of your email marketing strategy. Deliverability metrics include:
- Open rate
- Click rate
- Bounce rate
- Unsubscribe rate
- Spam complaint rate
This is an example of a deliverability report for a final reminder to purchase a product. This report shows how these 5 metrics have moved over a certain period of time.
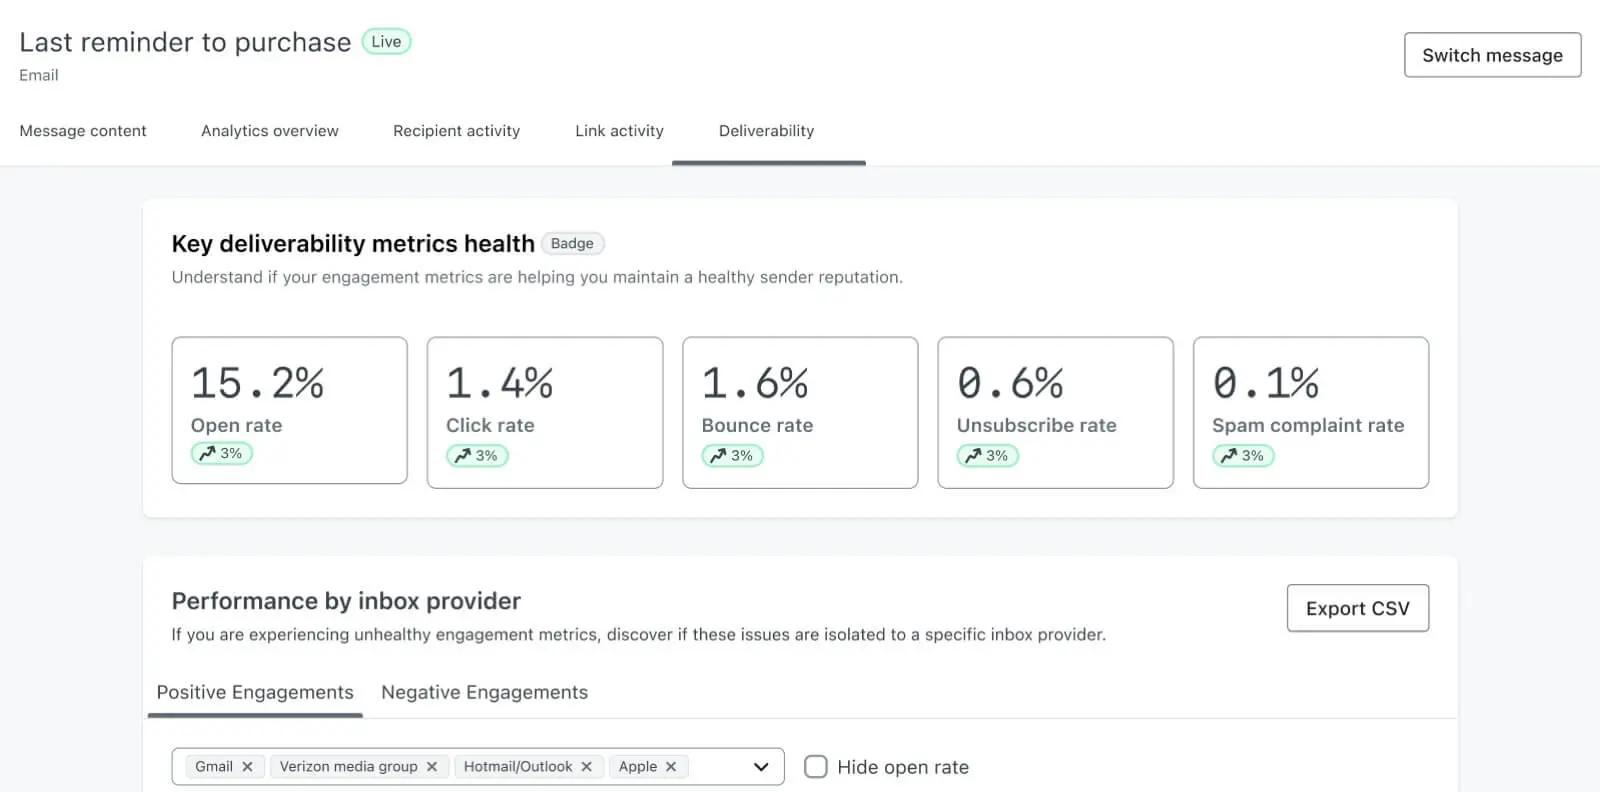
Your deliverability report should also put these metrics into context and flag any issues that could affect your overall sender reputation.
In this example, click rate is low and the unsubscribe rate isn’t ideal—not a catastrophe since the spam complaint rate is sitting at zero, but a sign the email needs some review if it’s going to become effective.

How to customize email reports to level up your business
After you master the basics of email reporting, you’ll be ready to fly in multiple directions. Custom reports are what you lean on when you really start to understand your business, what you need to work on, and what you need to do more of because it works.
When you’re building a custom report, you’ll likely be zooming in on:
- A specific metric or business key performance indicator
- Multiple metrics that relate to each other
- A specific product or set of products
Custom reports contain layers because data never exists in a silo. Similar to dominoes, one metric reacts to many other metrics that surround it. View your data through multiple filters, time frames, and modifiers to gain a true sense of how your business is performing.
To build a custom report, follow these general steps:
- Choose your metrics. Likely from a drop-down menu, isolate a set of metrics that influence each other.
- Choose the angle. Your angle is the way you want your questions answered. This may be represented by a sum of numbers vs. an average, a total number of actions vs. a unique number of actions taken only once per recipient profile, etc.
- Choose the group. A group is a modifier that gathers a specific type of information, like profile property data, which allows you to build a more tailored report around questions you may have about your audience segments.
- Add relevant modifiers. Instead of grouping your report by specific attribution or profile properties, you can instead choose to limit your results by filtering what data is included. For example, if you only want to report on performance for a specific gender, you can add this as a filter.
- Customize your time range. You may only care about data within a specific timeframe. In that case,customize the time range of your report so that it only shows the data you care about.
So how do you start assessing your email performance?
Your choice of email reporting tool will determine the granularity of the performance metrics you’re able to evaluate—and the ease with which you’re able to act on what you learn.
It’s critical to choose the best email reporting service that will deliver the experiences your customers want—and the revenue your business needs.
Jake Cohen, VP of Klaviyo’s Shopify partnership, has a recommendation on where you can start—and it’s a good one.
Grow smarter, digitally.
Email reporting FAQs
What are the key metrics in email reporting?
Key metrics in email reporting include click rate, conversion rate, website activity, total revenue per email, revenue per recipient, and unsubscribe rate.
Because Apple’s iOS 15 privacy features allow Apple Mail users to block third parties from tracking email opens, open rates are only valuable when they’re assessed against each other over longer periods of time.
When should you report on your marketing campaign performance?
You should report on your marketing campaign performance on a monthly or quarterly basis, but also on an ongoing basis. You’re running important email campaigns that may need live adjustments.
How can email reports inform and improve email campaigns?
Email reports inform and improve email campaigns by demonstrating, in concrete numbers, the level of interest in your email campaigns and automations. When marketers are able to assess the engagement rates and conversion rates that drive their email marketing strategy, they can make adjustments to design, copy, and audience segmentation to improve performance on a granular level over multiple timeframes.
How does A/B testing emails affect email reporting?
A/B testing your emails is an important way to improve email performance, and it’s often one of the first steps you’ll take toward improving the email metrics you see in your reports. You can A/B test things like subject line, templates, the call to action (CTA), the email content itself, and more.
With Klaviyo, you can A/B test email campaigns, email flows, individual emails, SMS messages, timing of emails, number of emails, and so much more.


