Inflation is still hitting consumers hard, regardless of age.
But according to new research, younger generations are more likely than their older counterparts to indulge in discretionary and luxury purchases—and to increase their holiday spending this season.
Based on responses from 3K+ US consumers, a new survey from Klaviyo and Qualtrics finds that while inflation is impacting current spending habits for 91% of consumers and future spending plans for 69%, Gen Zs and millennials are more likely to feel optimistic about the economy and its impact on their future spending plans—including over the holidays.
As student loan payments start up again and total American credit card debt exceeds $1T, financial confidence in any demographic presents unique opportunities for marketers looking to understand shopping behavior during times of economic uncertainty—and act on it in time to drive real business results this Black Friday Cyber Monday.
Now more than ever, it’s vital to spend time analyzing your customer segment behavior.
“Now more than ever, it’s vital to spend time analyzing your customer segment behavior,” says Sean MacBeth, interim leader of growth marketing at Chameleon Collective.
“Using this research,” MacBeth says, “you can develop a strategy that activates your first-party data in both owned and paid media channels to produce outcomes that drive profitable new customer acquisition and higher retention rates.”
Read on to learn more about how consumers feel about the economic outlook, their current spending habits vs. their future spending plans, and where—and how—they plan to shop this holiday season.
Economic perception: proceeding with caution
Overall, opinion of the current US economy is cautious: Over half of consumers feel negatively about the current state of the US economy (59%) and believe it’s trending downward (53%).
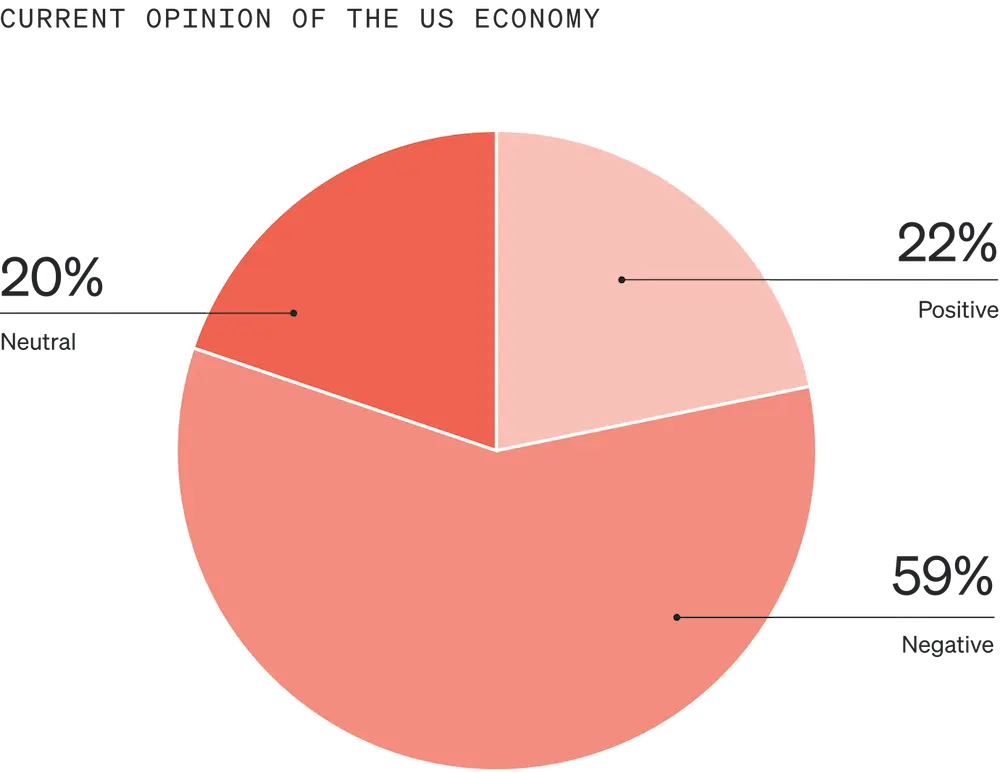
Still, 42% feel neutral or positive, and 46% believe it’s holding steady or on its way up—suggesting economic perception is relatively split and consumers are proceeding with caution.

Most consumers (91%) are already feeling the impact of inflation on their spending habits, and more than 4 in 5 have adjusted their spending habits in response. 69% of consumers believe inflation will continue to impact their spending in the future.
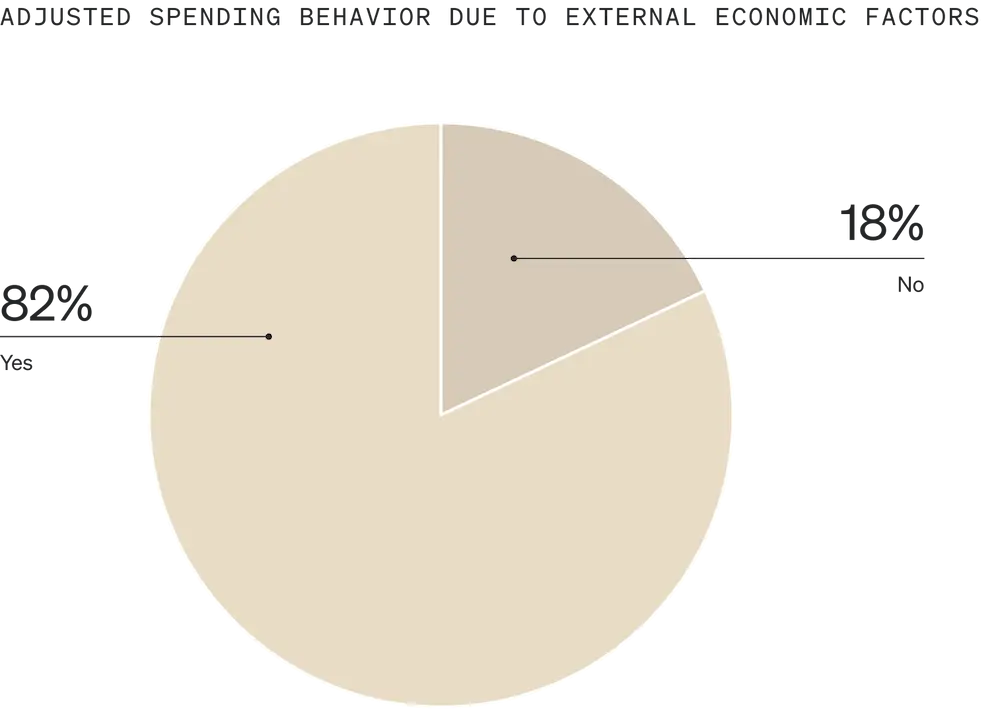
While only 9% say inflation is not currently affecting and is not likely to affect their spending decisions, 22% of consumers believe the impact of inflation will be short-term, and don’t expect it to have much of an effect on their future spending.

While Gen Zs and millennials are feeling the effects of economic headwinds as much as their older counterparts, younger generations are more likely to take an optimistic view of the economy and its potential impact on their future spending.
How to apply these findings to your marketing: build perceived value
“Knowingly or not, consumers solve for the equation of perceived value divided by cost,” says Spencer Flaherty, internal marketing manager at Groove Commerce. “If the result equals 1 or higher, they’re likely to purchase.”
“It all comes back to: What’s your ‘why’?” asks Matt Fier, VP of retention marketing at QDL Agency. “Show your value, build perceived value, and build exclusivity.”
To increase the perceived value of your product or service during a time of financial uncertainty, “demonstrate the various use cases and durability of your product for years to come,” Flaherty suggests. “Craft offers that address consumer concerns and objections head-on.”
Knowingly or not, consumers solve for the equation of perceived value divided by cost.
In that area, Fier challenges brands to keep it simple: “Figure out what you believe your top 3-5 objections will be, and hone in your messaging to 3 of them. Then, craft messages based on data to get over broader, macro trend objections.”
For example, “if you’re selling motorcycle crash protection to Gen X and boomer customers, offer a low-cost replacement warranty for riders who take a spill,” Flaherty says. “For Gen Z and millennial customers, showcase your gear’s features and styles.”
Figure out what you believe your top 3-5 objections will be, and hone in your messaging to 3 of them. Then, craft messages based on data to get over broader, macro trend objections.
You can also consider updating your sign-up form incentives to reflect greater deals during the holiday season, says Mckenzie Hibler, director of ecommerce marketing at Groove Commerce.
As Flaherty explains, “these methods will increase the perceived value of your product to each demographic group when compared to a perceived high initial investment cost.”
Consumer budget allocation: essentials are taking over
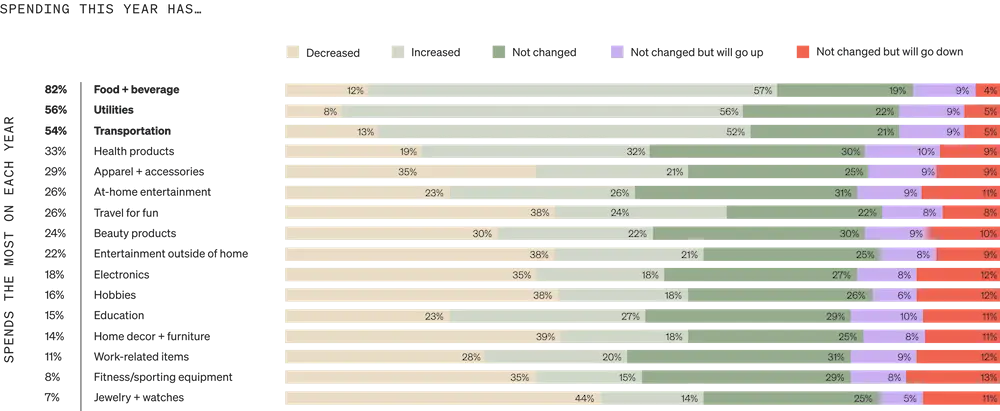
On average, consumers are allocating most of their budgets to conventional items such as food (82%), utilities (56%), and transportation (54%). These spending allocations are similar to last year, when consumers spent 73%, 67%, and 61% of their budgets on these categories, respectively.
Like this past year, most consumers (69%) expect to invest the majority of their incomes in these areas over the next year—placing an emphasis on conventional goods, and being more diligent about discretionary spending.
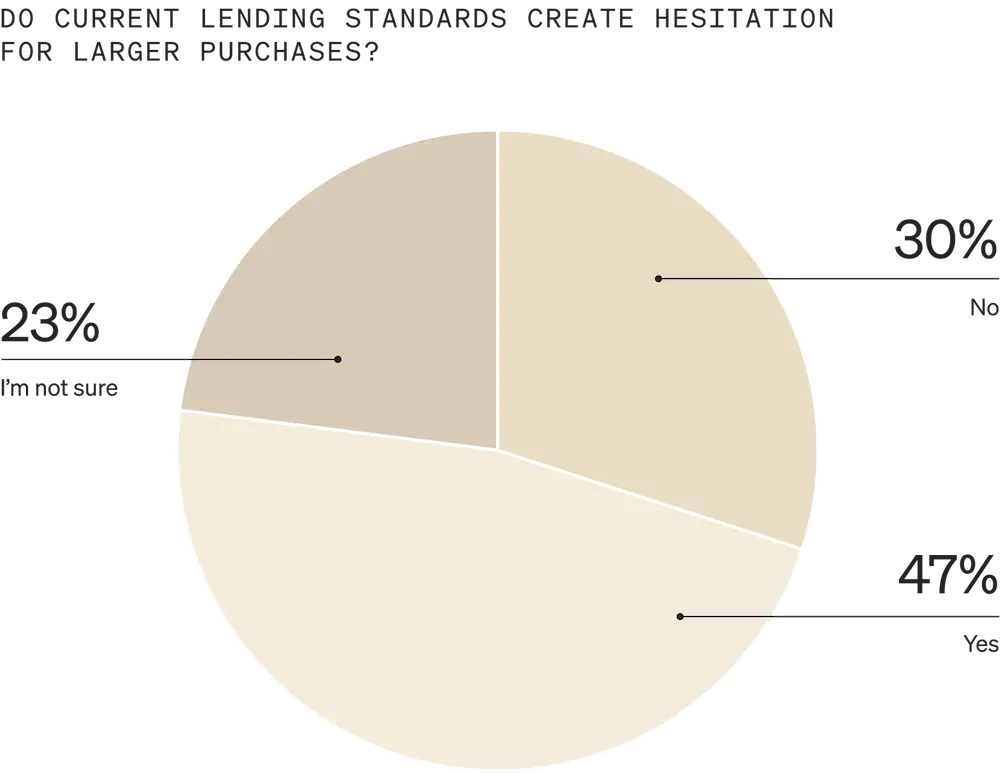
Similarly, due to current lending standards and credit availability, nearly half (47%) of consumers are hesitant to make larger purchases, opting to either delay their purchase plans (53%), postpone the purchase indefinitely (39%), downsize the purchase or find a more affordable option (36%), or focus on saving more so they can make a larger down payment (24%).
But “even in a shrinking market, there will be winners and losers,” Flaherty points out. “Those who manage to win during ‘bad times’ will see their efforts returned tenfold when the market turns around.”

What this means in practice, Flaherty adds, “will vary widely between product categories and individual merchants.”
Current vs. future spending: conventional items demand the most dollars
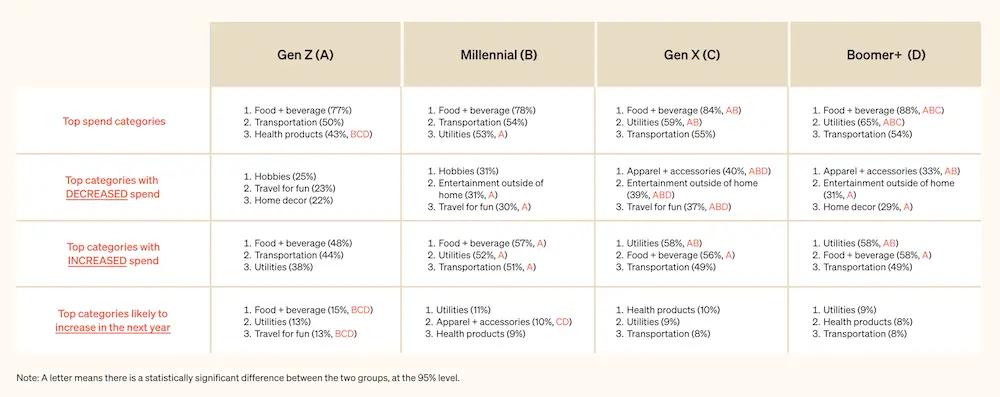
Across the board, consumer spending has increased on conventional items such as food (57%), utilities (56%), transportation (52%), and health products (32%).
Average consumer spending has decreased, meanwhile, in categories such as jewelry and watches (44%), home decor and furniture (39%), hobbies (38%), entertainment outside the home (38%), and travel for fun (38%).
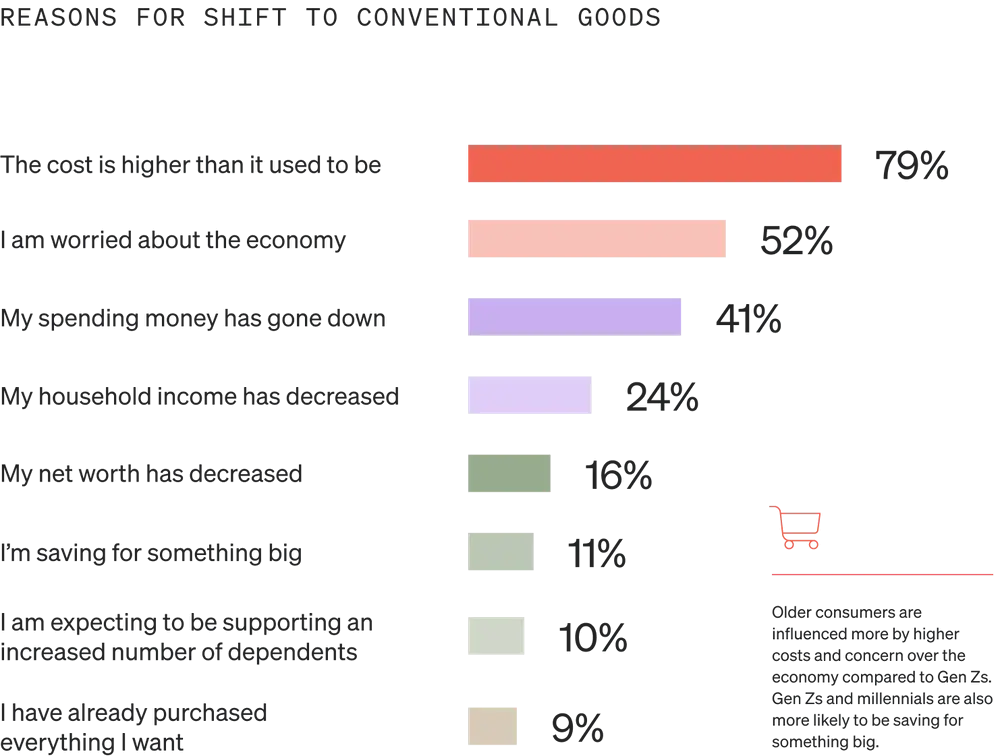
Over the next year, 69% of consumers expect to spend the majority of their income on conventional goods like groceries, utilities, and transportation—and 40% say this marks a shift in their normal spending habits.
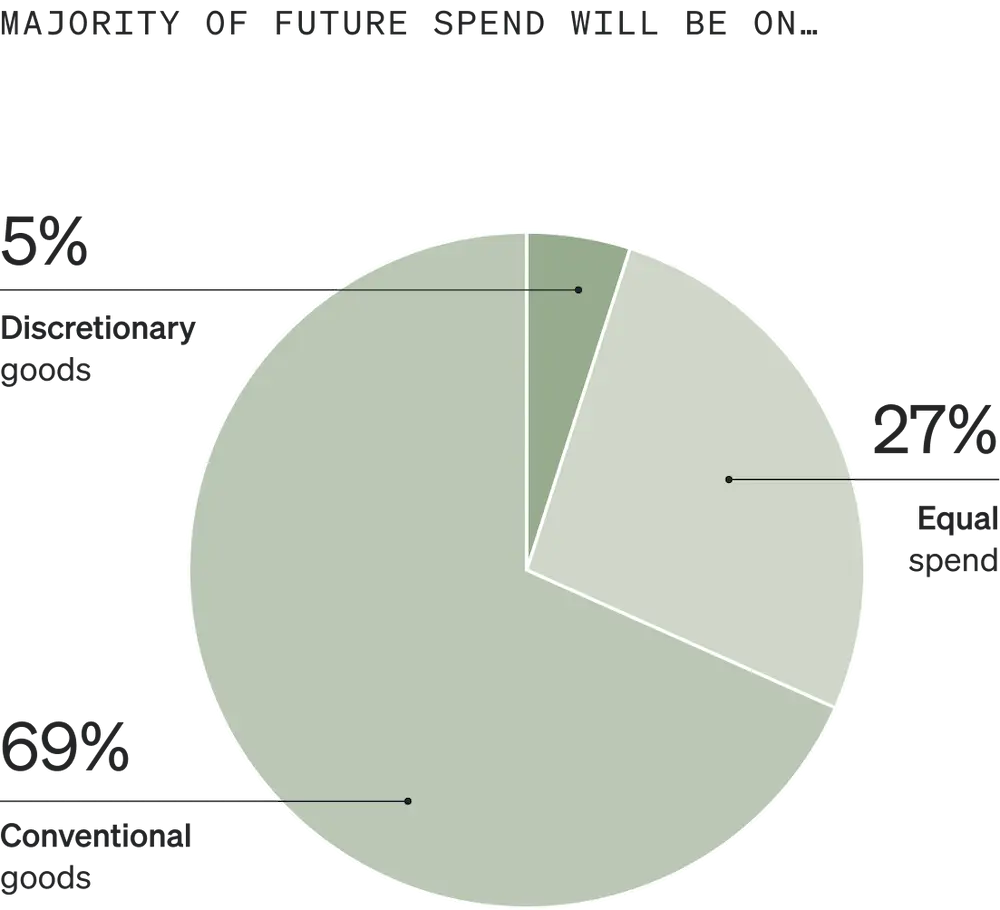
Note that whereas older consumers are more likely to attribute this shift to higher costs and concerns over the economy, Gen Zs and millennials are more likely to say it’s because they’re saving for something big.
Younger generations are also more likely than older ones to plan on increasing their spend on food, travel for fun, and apparel and accessories over the next year.
How to apply these findings to your marketing: be aggressive
Whether your brand sells discretionary items, conventional goods, or both, Flaherty suggests implementing the methodology of Alex Hormozi: “Make an offer so good, people feel stupid saying no.”
“Since the majority of discretionary spending will be done by younger consumers, we should target our messages to them directly,” Flaherty explains.
For a company selling pet-related products, for example, a great offer might look something like this, Flaherty says: “Try our ‘real-life’ sound-emitting electronic bird chase, guaranteed to increase your cat’s interactivity or your money back. Shipping is on us.”
Since the majority of discretionary spending will be done by younger consumers, we should target our messages to them directly.
On the other hand, “since conventional goods spending is rising—due to inflation, not increased demand—demonstrate the increased value your product offers over others at the same price point,” Flaherty suggests.
A company selling fitness supplements, for example, might craft an offer that promises something like this, Flaherty says: “Our $24.99 container has been independently measured to provide 15% longer-lasting effects than [Main Competitor].”
In categories where spend is increasing, Fier urges marketers to “be as aggressive as possible.”
Be willing to take smaller overall net profits by believing you’ll retain them for returning purchases later on. I like to view BFCM as an opportunity to have higher CACs for retention conversions because I believe we will reconvert them after that holiday purchase.
“Be willing to take smaller overall net profits by believing you’ll retain them for returning purchases later on,” Fier suggests. “We talk a lot about customer acquisition costs (CACs) with paid media, but I like to view BFCM as an opportunity to have higher CACs for retention conversions because I believe we will reconvert them after that holiday purchase.”
Get a primer on the best retention marketing strategies from more than 15 thought leaders across ecommerce industries.
Read full storySimilarly, in categories where spend is decreasing, “focus on your hero products and push those heavily,” Fier advises. “Take your products’ value propositions and push messaging that gets shoppers to choose you over a competitor or better offer—because there will almost always be a better offer.”
Goods vs. services: deals and discounts drive spending for both
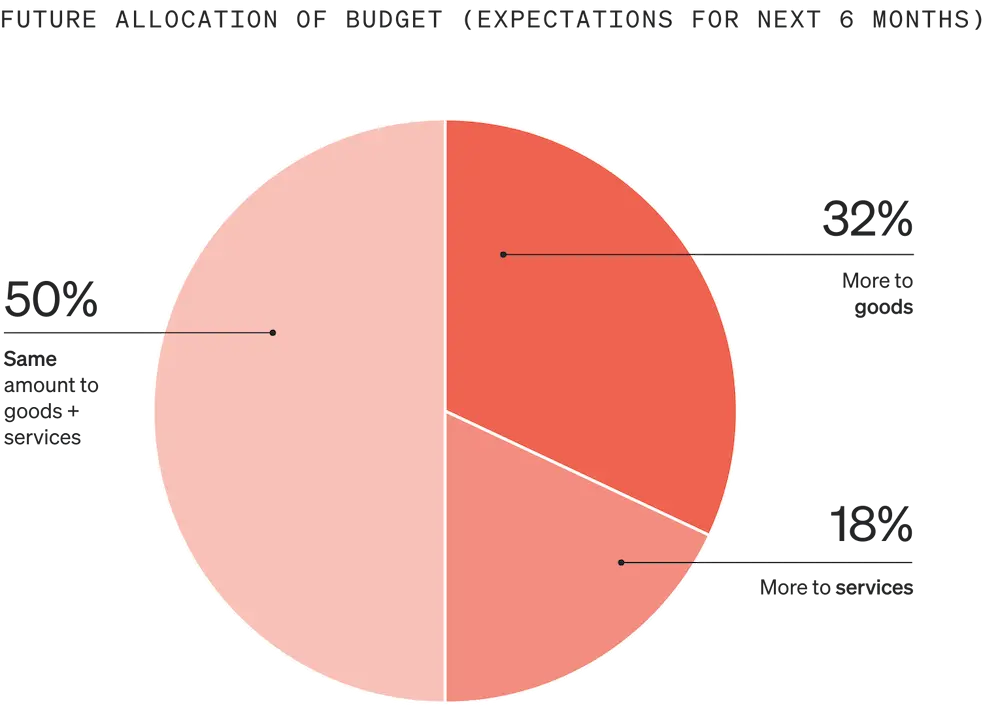
Half (50%) of consumers currently allocate an equal amount of their budget to goods and services, while a third (33%) allocate more to goods.
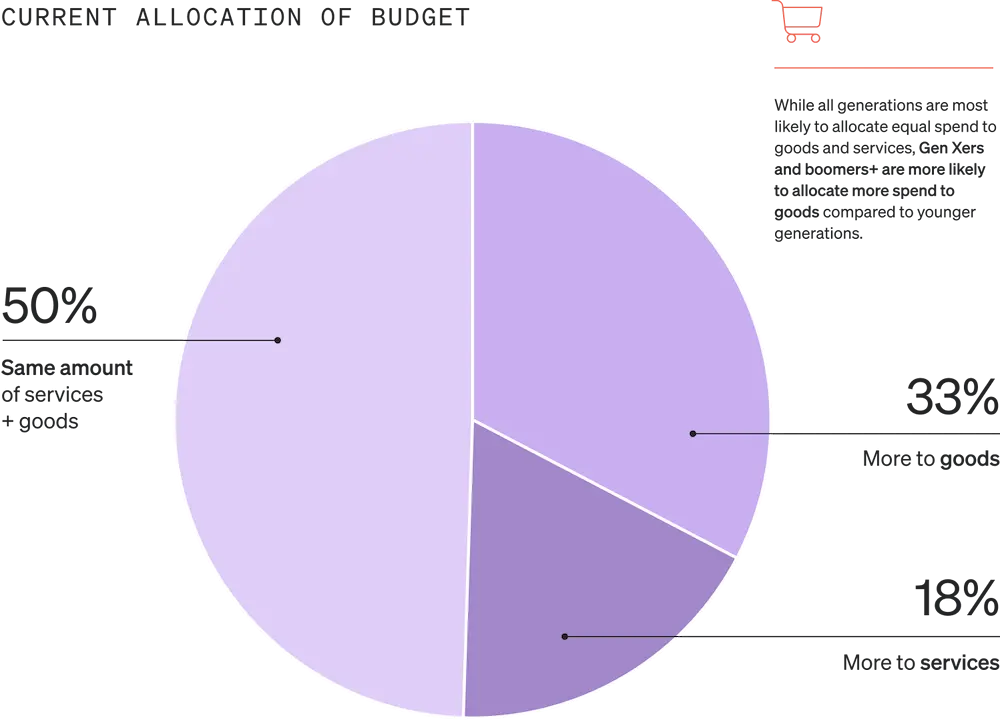
Over the next 6 months, half (50%) of consumers expect this budget allocation to stay the same, while nearly a third (32%) expect to allocate more to goods than services.
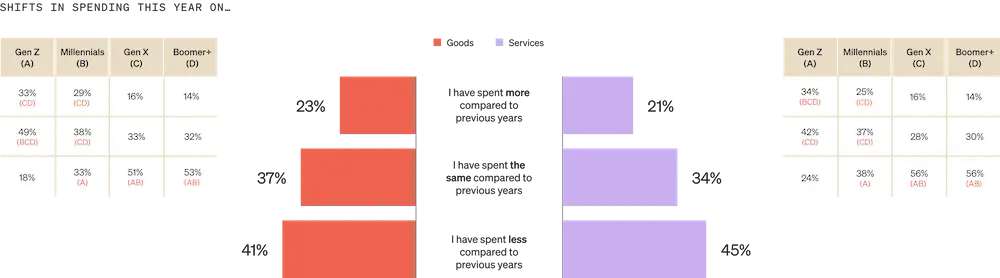
While Gen Xers and baby boomers are more likely than their younger counterparts to allocate more of their current budget to goods than services, they’re also more likely to have decreased their spending in both categories over the past year. Gen Zs and millennials, meanwhile, are more likely to have increased spending on both goods and services over the past year.
Deals and discounts are top drivers for both goods and services spend (42% and 44%, respectively), while a desire for experiences and entertainment (50%) drives people to allocate more of their budgets toward services.

Of those who spend more money on goods, older generations tend to be more interested in upgrades and replacements, whereas younger consumers tend to be more interested in either new products that enhance their home environments, or simply collecting more personal belongings.
How to apply these findings to your marketing: make it personal
If you sell products or services that promise an experience, “remember that even customers with the best intentions have personal motivations,” Flaherty says. “Demonstrate how the experience can be shared by both the gift giver and the recipient. Consider tapping into the ethos of the give-gifter by alluding to the bond that the two will build together.”
Demonstrate how the experience can be shared by both the gift giver and the recipient. Consider tapping into the ethos of the give-gifter by alluding to the bond that the two will build together.
Luxury spending: the “lipstick effect” works on younger generations
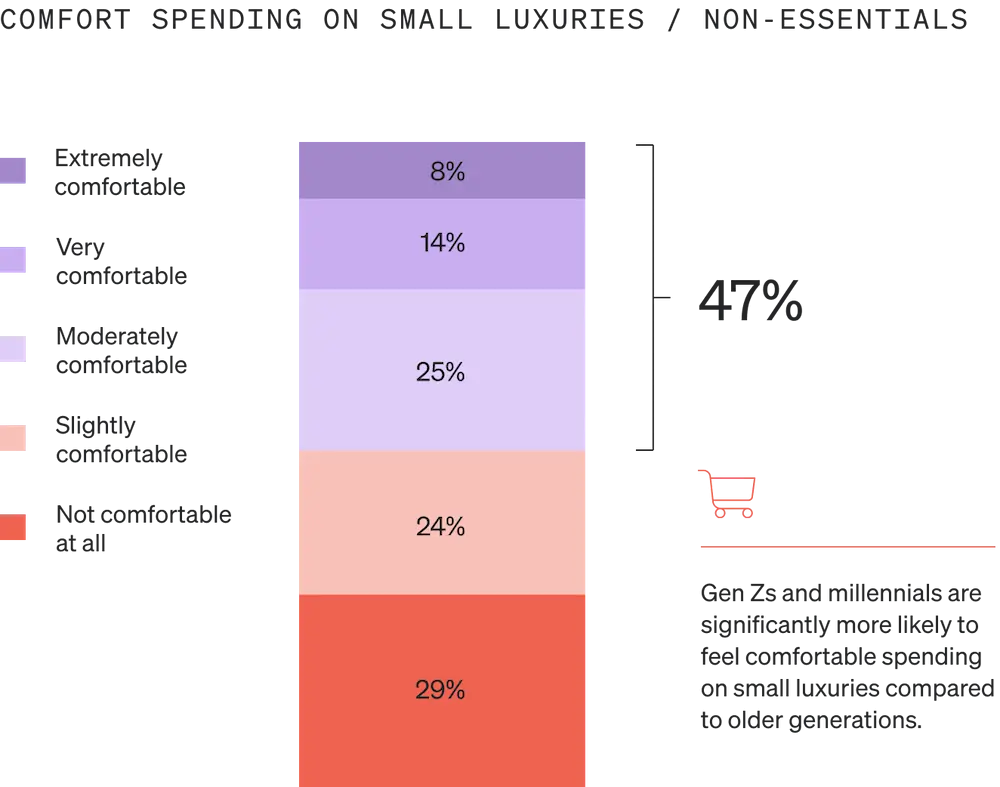
Nearly half (47%) of consumers feel at least moderately comfortable spending money on small luxuries and other non-essentials.
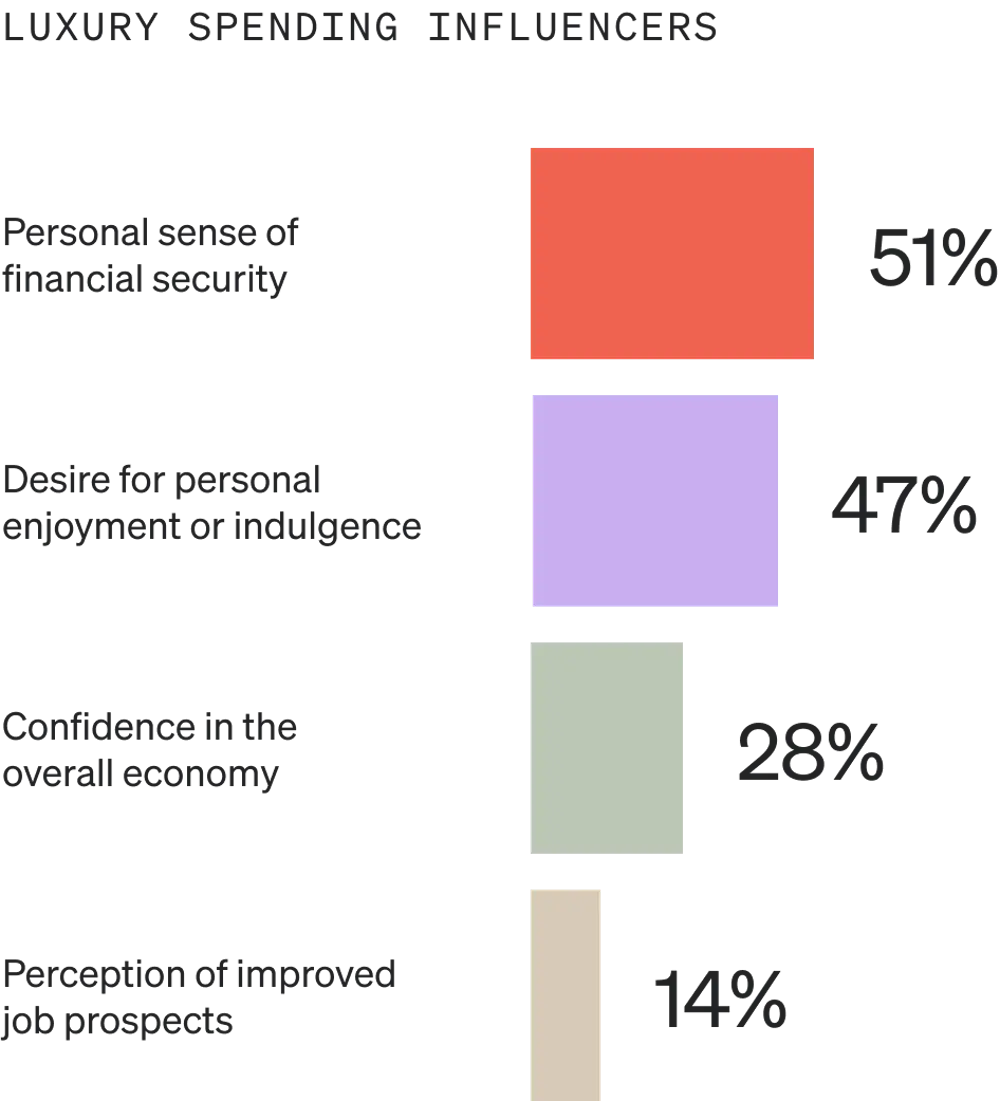
Top influencers for luxury spending include a personal sense of financial security (51%) and a desire for personal enjoyment (47%).
Younger generations are significantly more likely than older generations to be comfortable spending money on small luxuries. Gen Zs and millennials are more susceptible than their older counterparts to the “lipstick effect”: a psychological phenomenon in which cash-strapped consumers treat themselves to small luxury items.
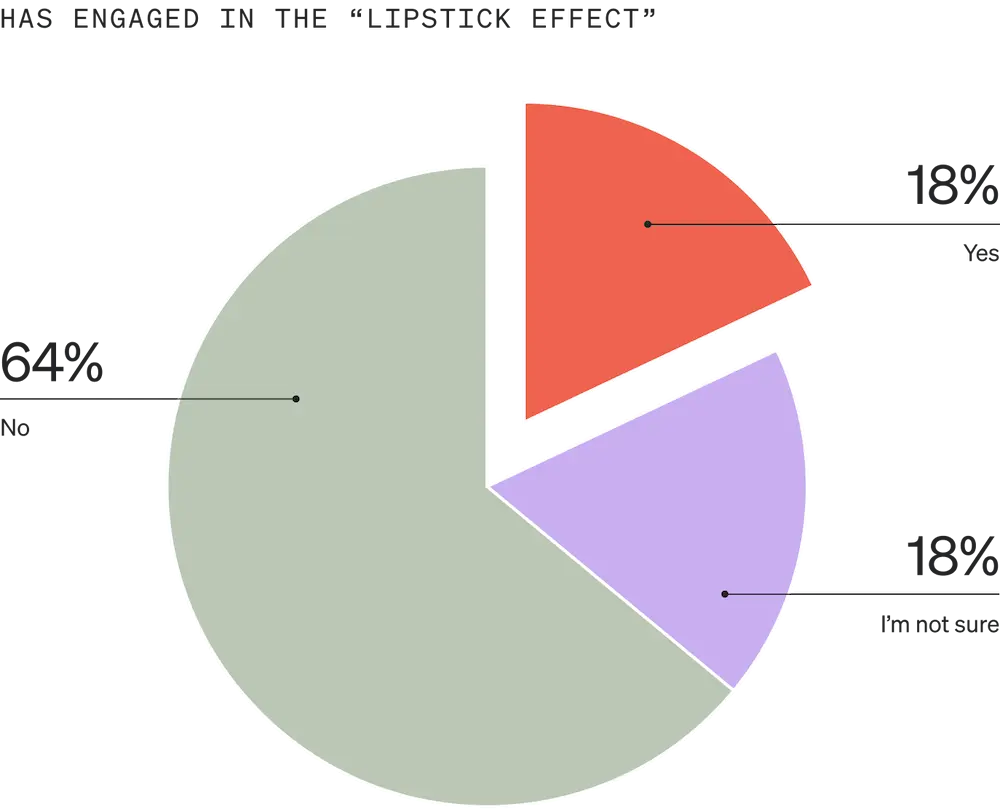
While less than 1 in 5 consumers, overall, have engaged in the lipstick effect during times of economic uncertainty, those who do are most likely to treat themselves to beauty services (46%), makeup and skincare products (46%), fast fashion (45%), and gourmet or premium food and drink (45%).

Whereas boomers are most likely to indulge in gourmet or premium food and drink as a result of the lipstick effect (58%), Gen Zs are most likely to treat themselves to fast fashion apparel and accessories (58%).
How to apply these findings to your marketing: go above and beyond
In the luxury vertical, it’s even more important to “start your education early,” Fier says.
“The more expensive the product—TVs, furniture, electronics, etc.—the more likely people will be to wait for Black Friday,” Fier points out. “Start educating now across all your channels. Give people zero excuses come game day.”
The more expensive the product—TVs, furniture, electronics, etc.—the more likely people will be to wait for Black Friday. Start educating now across all your channels. Give people zero excuses come game day.
To that end, Hibler emphasizes the importance of using social proof in marketing messages. “Reviews are extremely important in today’s online shopping world,” she says. “Don’t be afraid to lean into that.”
Why do ecommerce reviews matter? Because most consumers won’t buy from you without them.
Read full storyBut because high-end and luxury brands struggle to keep CACs low, Flaherty says, customer retention is even more important in this vertical—and even more challenging. “Simply put, a generic automated email requesting feedback and reviews isn’t always enough,” Flaherty points out.
Reviews are extremely important in today’s online shopping world. Don’t be afraid to lean into that.
Instead, he recommends personally reaching out to these customers 1 week, 1 month, 3 months, and 1 year after their purchases. “These calls should center on their satisfaction with the product they purchased, as well as information about similar or complementary products that have just been released,” Flaherty explains. “Consider special ‘try-it-on’ offers for customers who have exhibited purchase intent.”
In-store vs. online shopping: preferences don’t reflect reality
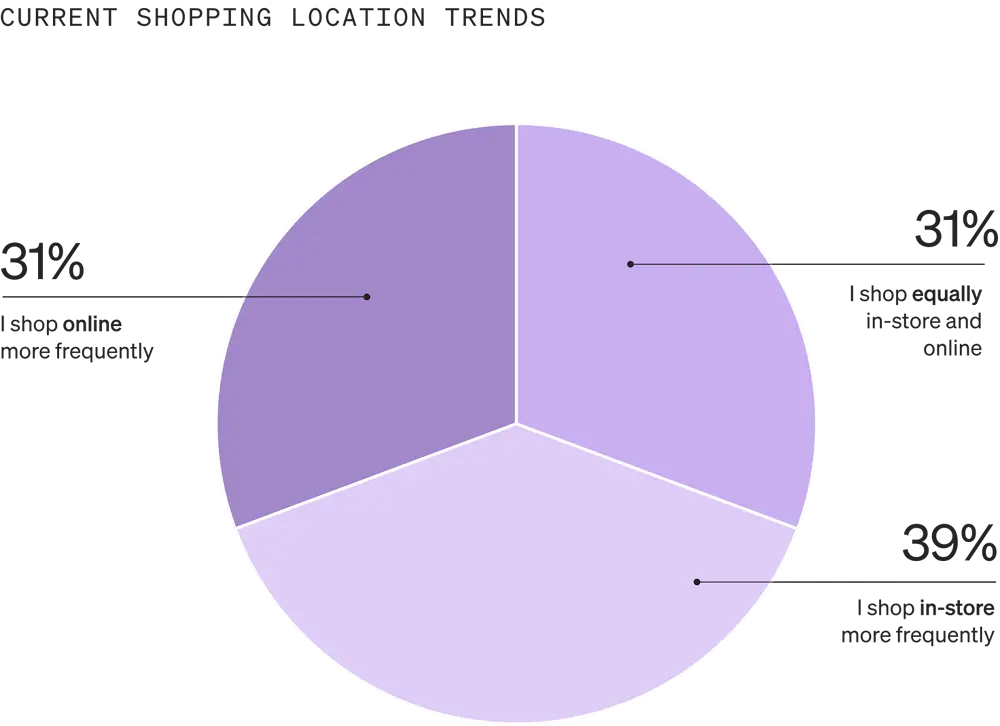
Although consumers are 2.25x more likely to prefer shopping online (45%) to shopping in-store (20%), they’re currently shopping just about equally online (31%) and in-store (39%).
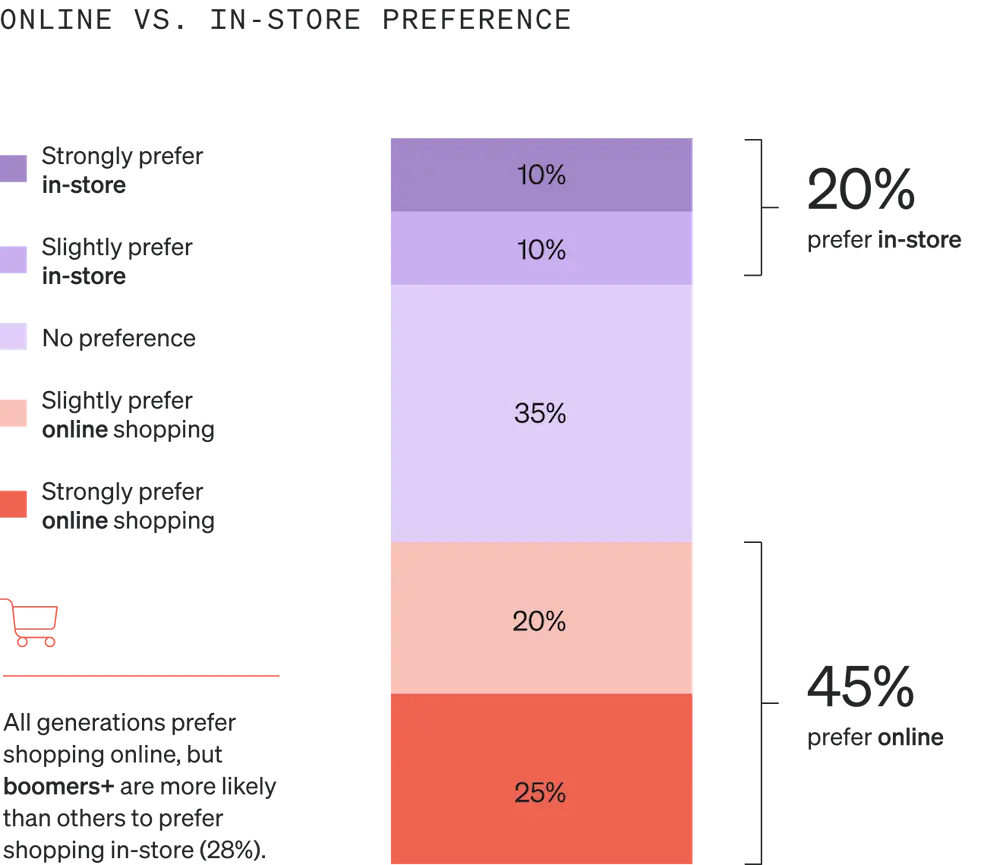
By generation, all demographics prefer shopping online, but boomers (28%) are more likely than their younger counterparts to prefer shopping in-store.
Why people shop in-store: immediate product availability and exclusive in-store promotions
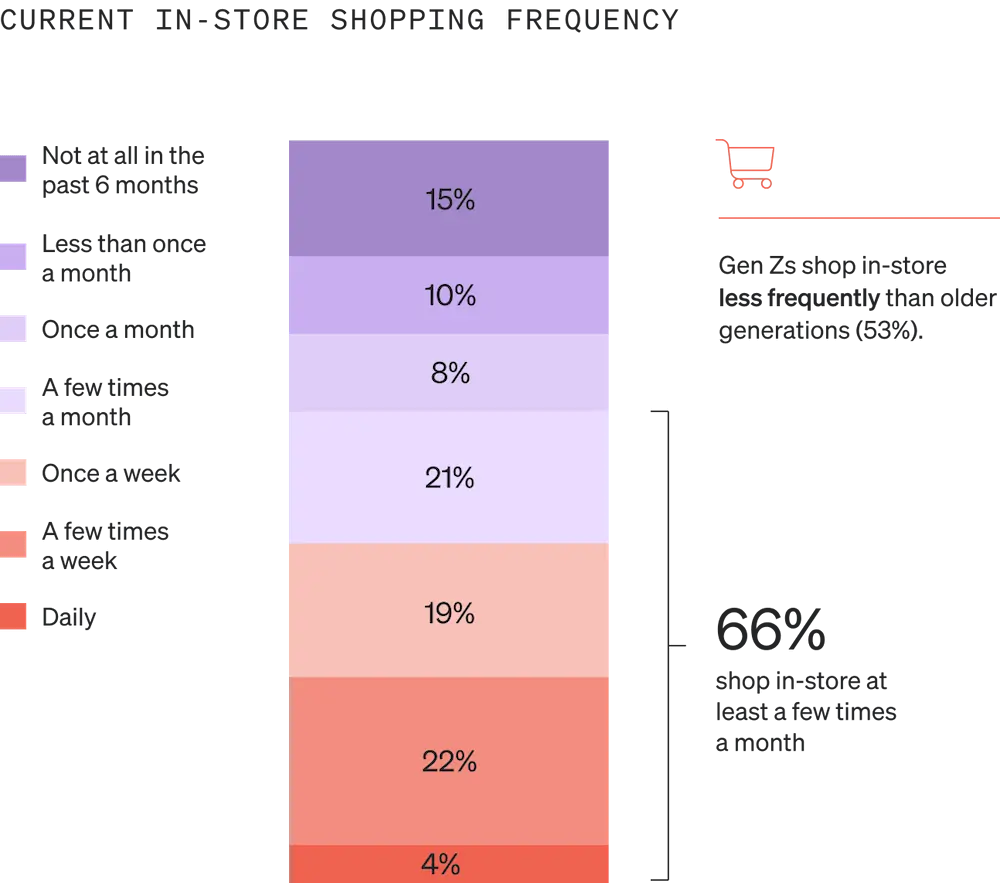
More than half (66%) of consumers who shop in-store do so at least a few times a month. Gen Zs (53%) shop in-store less frequently than their older counterparts.
The top reasons people shop in physical stores include the ability to see and touch products (59%), immediate product availability (59%), and convenience (52%). Of those who visit a store to make a return, 71% are likely to purchase additional items during their trip.

In the future, consumers say exclusive in-store promotions or discounts (53%), wider product selection (45%), and immediate product availability (34%) could incentivize them to shop in-store.

Whereas in-store promotions and immediate product selection become more important with age, nearly a quarter (24%) of Gen Zs are seeking social interaction when they shop in-store.
How to apply these findings to your marketing: underpromise and overdeliver
When it comes to in-store promotions, “underpromise and overdeliver,” Flaherty suggests.
Building goodwill with in-store customers will have them coming back for years.
“Share in-store-only promotions and events that would draw your segmented audience into the store,” he explains. “If your offer promises a free ‘X’ to those who buy over $50 in goods, throw in ‘Y’ for good measure. Building goodwill with in-store customers will have them coming back for years.”
Why people shop online: convenience and the influence of email marketing
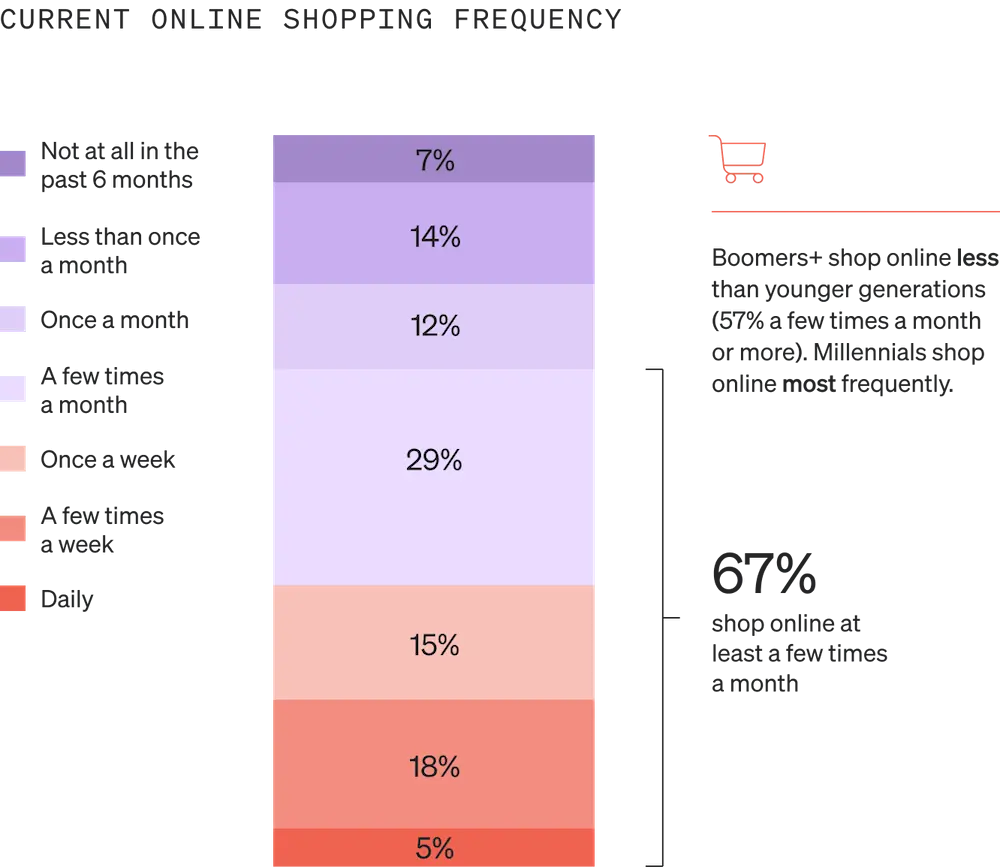
More than half (67%) of consumers who shop online do so at least a few times a month. Boomers shop online less frequently than their younger counterparts, especially millennials, who shop online most frequently.
The top reasons people shop online include convenience (72%), home delivery options (56%), and greater product variety (50%). Whereas older generations are more likely to shop online for convenience and competitive prices, younger generations are more likely to shop online for greater product variety.

If you’re selling online, what’s the best way to get people to your ecommerce store? Nearly half (49%) of consumers prefer email over all other methods of brand marketing, followed by social media (18%), direct mail (16%), and text messaging (14%).
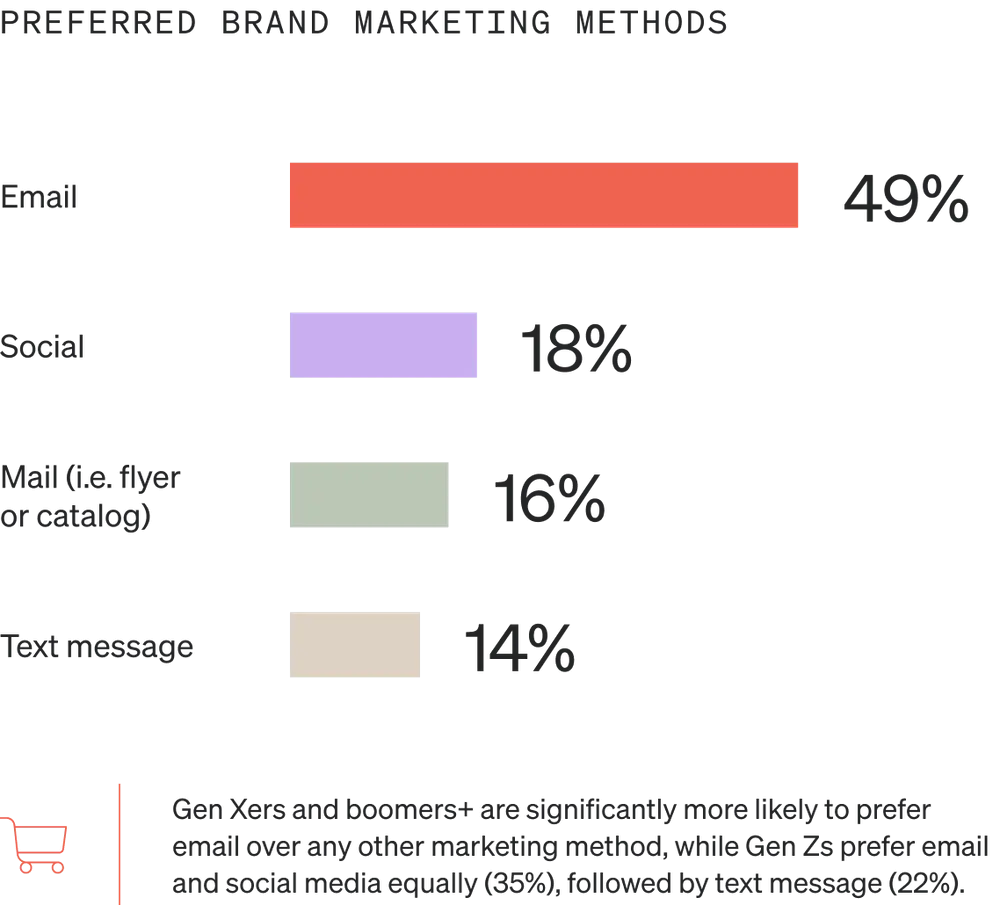
While Gen Xers and boomers are significantly more likely to prefer email over any other form of marketing, Gen Zs prefer email and social media equally (35%), followed by text messaging (22%).
How to apply these findings to your marketing: eliminate marketing for marketing’s sake
When planning your holiday marketing, identify and segment audiences based on preferences like these, MacBeth advises: “Lean in especially to SMS, which yields high open, click, and conversion rates.”
Don’t send emails just to send them. Too many emails, especially too many with empty offers, will burn out your contact list.
And “don’t send emails just to send them,” Flaherty cautions. “Make sure you provide a defined offer that is designed specifically for your segmented audiences. Too many emails, especially too many with empty offers, will burn out your contact list—making them even more difficult to convert in the future.”
“Preach. Your. Value,” Fier agrees. “So many brands forget that nearly zero people read every single email that you send to them. They’re not going to remember everything. On top of that, we have 5-7 seconds per email before they bounce to their next email/text/etc.”
Preach. Your. Value. Make sure the customer can immediately recognize why going through your online store is the most convenient and pragmatic choice.
“Keep your messaging simple and preach your ‘why,’” Fier adds. “Then, make sure the customer can immediately recognize why going through your online store is the most convenient and pragmatic choice.”
The bottom line, Fier says: “Use their emotions to encourage their logic.”
What about shoppers who shop both in-store and online?
Nearly a third of consumers (31%) shop equally in-store and online—the same amount that shops online more frequently (31%), compared to 39% who shop in-store more frequently. And 35% of consumers say they have no preference between shopping in-store and online, compared to 20% who prefer in-store shopping and 45% who prefer online shopping.
These findings support the argument from McKinsey & Company that today’s “customers want—and expect—to engage seamlessly across 10 or more” channels, from email and smartphone apps to web and video chats.
They are not fazed by switching between, say, a personalized offer on a retail website coupled with a push notification via their browser or app, followed by an email update prompting them to make a local in-store pick-up.
Kunle Campbell, host of the 2X eCommerce Podcast and co-founder of Octillion Capital Partners, agrees that channel-hopping, with ease, is the key attribute of the omnichannel shopper.
“They are not fazed by switching between, say, a personalized offer on a retail website coupled with a push notification via their browser or app, followed by an email update prompting them to make a local in-store pick-up,” Campbell explains. “Once in-store, they may browse an interactive catalog to make further purchases.”
In other words, people shop all over the place, across a wide range of devices and channels—which means online shoppers, in-person shoppers, and hybrid shoppers all expect a seamless omnichannel customer experience from the brands they do business with.
How to apply these findings to your marketing: create an omnichannel customer journey
“Try to brainstorm ideas that combine channels,” suggests Hibler, who offers several examples:
- Using online sign-up forms to collect RSVPs to in-store holiday events and gain more subscribers
- Leveraging loyalty programs to purchase in-store and online to gain more points
- Handing out coupons at in-store check-out for deals shoppers can redeem online
- Sending segmented emails to both online and in-store purchasers to increase total shopping across channels
Ritu Khanna, VP of partnerships at Shopify, agrees that “merging the physical and digital shopping experiences is one way to boost customer satisfaction and reach customers where they want to shop.”
Another way to do this, she says: offering buy online, pick up in-store (BOPIS) options, where people can shop and check out online, then pick up their order in-store or through curbside pickup.
Merging the physical and digital shopping experiences is one way to boost customer satisfaction and reach customers where they want to shop.
Fier believes more people will end up buying in-person this year than even these findings suggest. “With the increased traffic from in-office requirements and total lifts of social restrictions, people will always choose convenience, even over slight savings,” he says. “Use your online presence to push to stores.”
You might consider excluding certain segments from those efforts, such as loyal and returning customers. “I don’t want to turn them into in-store shoppers,” Fier explains. “But for those who engage with our emails but don’t covert? Let’s make this as easy as possible for them.”
With the increased traffic from in-office requirements and total lifts of social restrictions, people will always choose convenience, even over slight savings. Use your online presence to push to stores.
Finally, make sure your financial goals make sense, Fier cautions: “You’re not going to see an increase in ecomm and retail to some ridiculous scale that looked good at the end of the 2022 COVID bull market. In-store and online will be interconnected this year, more than likely correlating to a decline in growth for one channel.”
Holiday shopping predictions: consumers will spend about the same as last year
This holiday shopping season, most consumers are planning to shop primarily online during the months leading up to the holidays—and despite ongoing economic challenges, most people are planning to spend about the same amount as in previous years.
Where and when: online in October and November
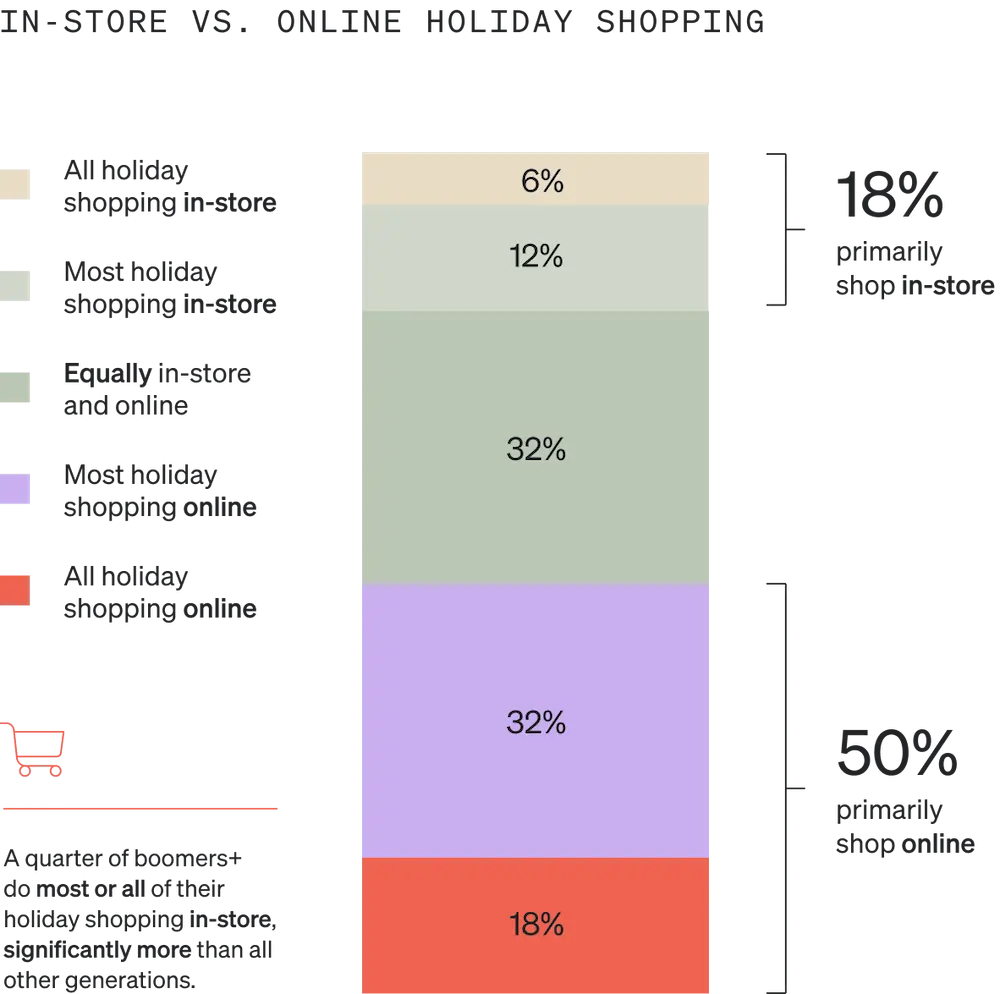
For some, the days of standing in long lines for doorbuster deals are over: Half (50%) of consumers plan to shop primarily online this holiday season, compared to only 18% who plan to shop primarily in-store.
For 67% of consumers, this will not be a change from last year.
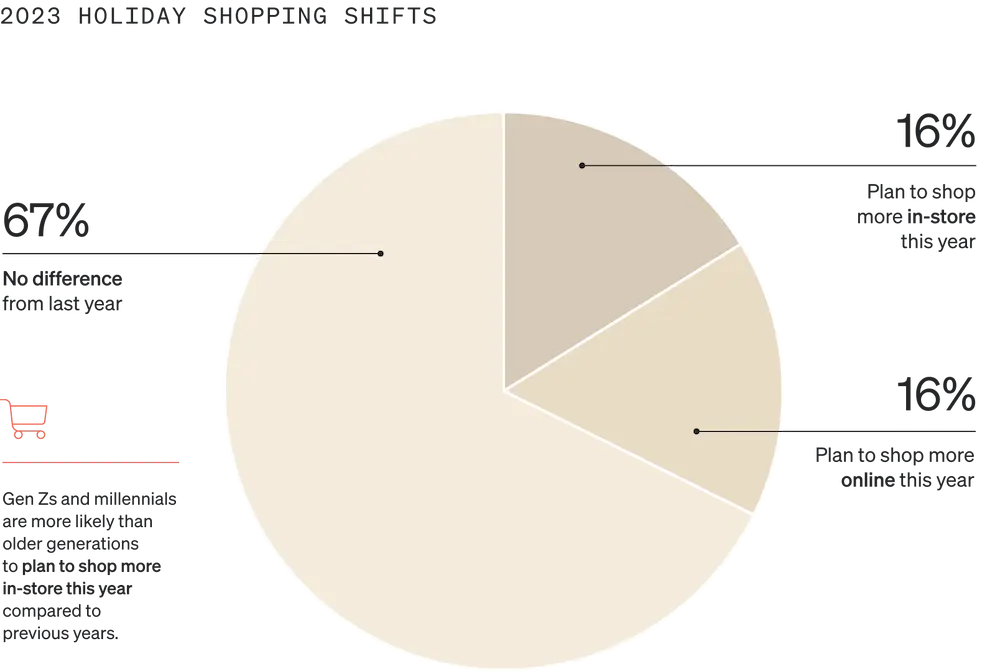
A quarter (25%) of boomers, however, do most or all of their holiday shopping in-store—significantly more than their younger counterparts. Younger generations, meanwhile, are more likely than older ones to plan to increase their in-store holiday shopping this year compared to previous years.
Most consumers (46%) do their holiday shopping in the months leading up to the holidays. But whereas Gen Zs are more likely than their older counterparts to buy gifts during the month the holiday falls (32%), Gen Xers and boomers are more likely than their younger counterparts to do their shopping throughout the year (19% and 20%, respectively).

For consumers who shop primarily during deal days, Black Friday still reigns supreme (82%). But fall Amazon Prime Day is now equally as popular as Cyber Monday: The same percentage of consumers (59%) report shopping on both deal days, compared to only 36% who shop on summer Amazon Prime Day.

How to apply these findings to your marketing: mix it up
Consider doing something new with your Black Friday sales this year, whether it’s spacing out the timing or featuring a different product line than your bestseller.
“Brands often run the same or similar deals,” Hibler points out. “Change up what you’re calling those sales and the product categories you’re featuring. There’s so much noise around the BFCM season that it’s important to stay fresh and change up the look and feel of sales.”
There’s so much noise around the BFCM season that it’s important to stay fresh and change up the look and feel of sales.
“Step out of the vacuum,” Fier agrees. “It’s really easy to live, eat, breathe, and (hopefully not) die in your brand. Take a step back and realize there will be more brands than ever offering higher discounts than ever for a longer period of time than ever.”
In a buyer’s market, “find your niche, keep it simple, and don’t get cheap during the holidays,” Fier advises. “This is when you keep loyalists happy and convert those who have either sniffed around before or just found out about you from a listicle you made.”
Delight your ecommerce customers with 10 BFCM strategies that consumers loved last year.
Read full storyThis can be tricky during BFCM, when you’re juggling an influx of potential customers who might be outside your normal demographics. Whatever you do, don’t make the mistake of treating new customers the same as returning ones.
Find your niche, keep it simple, and don’t get cheap during the holidays. This is when you keep loyalists happy and convert those who have either sniffed around before or just found out about you from a listicle you made.
Fier’s team approaches returning customers with two questions in mind: “How do we continue to raise our value to our loyal customers to encourage increased lifetime value (LTV)? And how do we prevent loyal customers from becoming churn risks by shopping us with other brands?”
“I am a firm believer that we want to turn brand loyalists into brand evangelists,” Fier explains. One way to do this: offer incentives, but get creative about it. He provides two examples from real-life clients:
- “Last year, we ran a promotion where everyone who spent $100 got a $10 gift card for a ready-to-drink bottled cocktail company. We ran it from October right up until the lead-up to their Black Friday promotion. This encouraged an initial purchase outside of subscriptions and a reason to come back. In November, we pivoted, saying, ‘This is free money you can use for our biggest sale of the year.’ We also ran this for a short period after BFCM for gifting season.”
- “I love to have our uber brand loyalists become evangelists by putting together new bundles for gifting season. Whether pre-made by the brand or a ‘build your own’ bundle with a discount, those who buy from you will want others to share that experience. That makes your loyal customer an immediate evangelist, which helps us then turn the gift receiver into a hot acquisition opportunity.”
Want to get even more granular? “Throw a QR code card into the box that pushes to email and/or SMS sign-up forms,” Fier suggests.
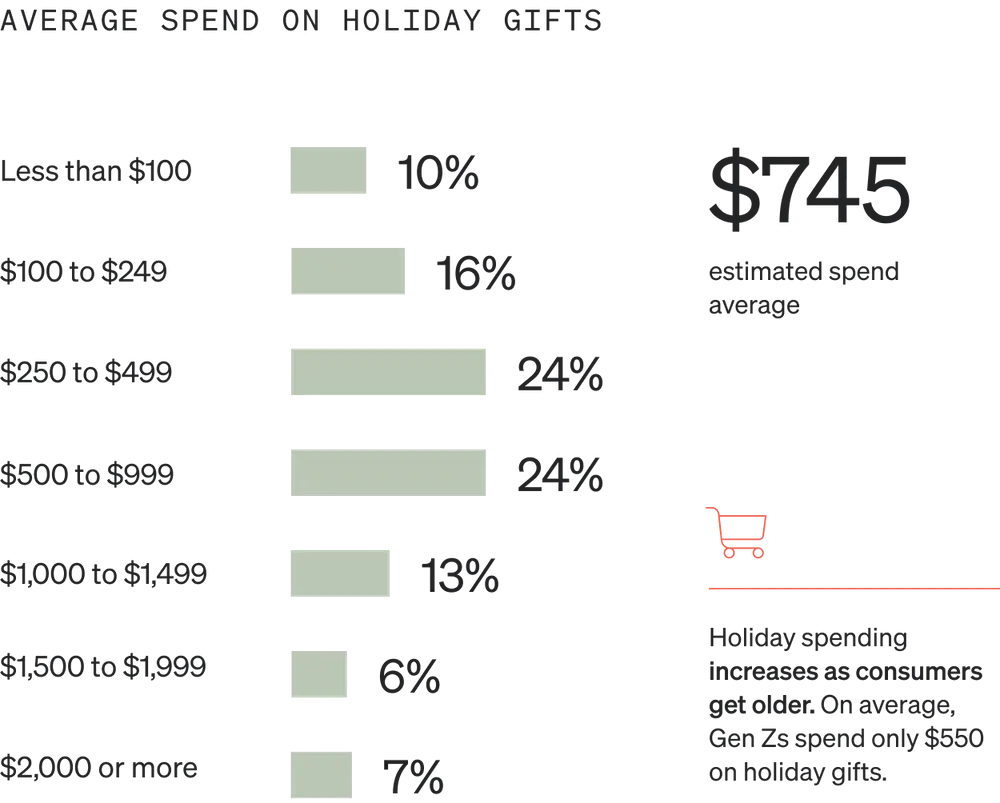
How much: $745 on average
On average, consumers spend $745 on gifts during the holidays. While the highest proportion of consumers (24%) spend $250-499 or $500-999 on holiday gifts each year, holiday spending increases with age. Gen Zs, for example, spend only $550 on average on holiday gifts.
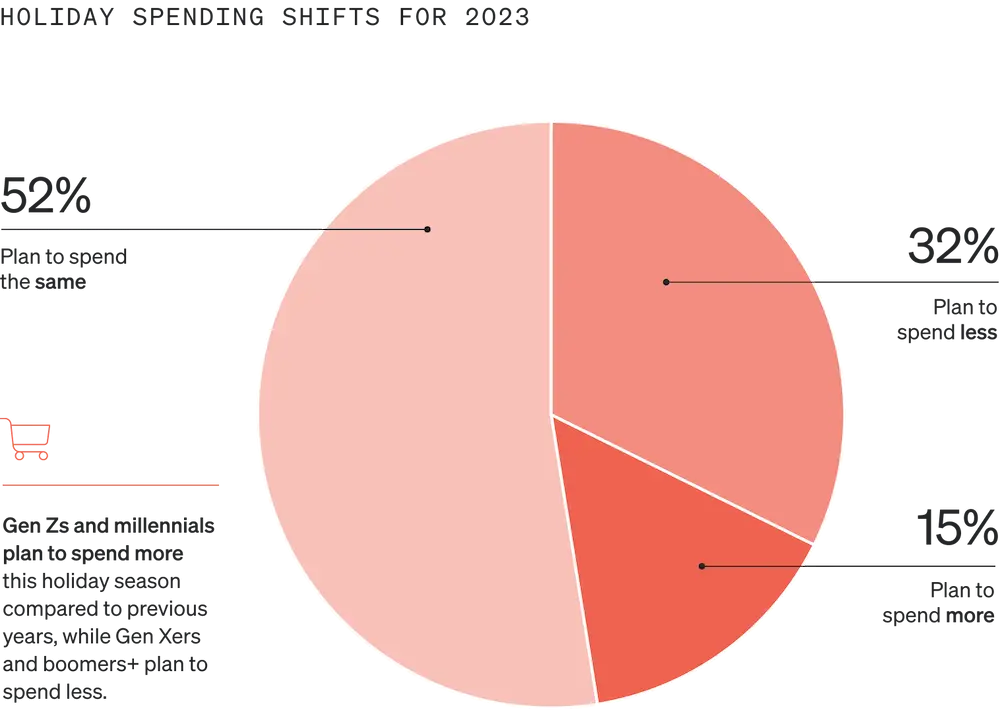
This year, more than half (52%) of consumers plan to spend the same amount on holiday gifts as last year, but nearly a third (32%) of consumers plan to spend less. Gen Zs and millennials are more likely than their older counterparts to increase their holiday spending this year, while boomers and Gen Xers are more likely to decrease theirs.
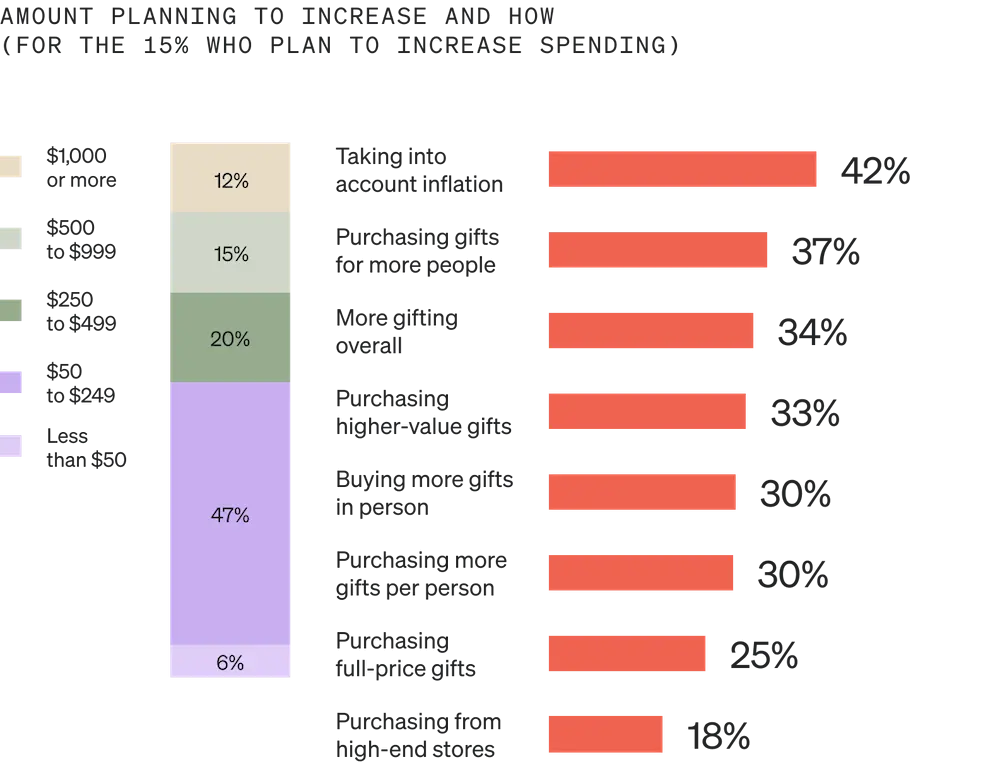
Of the 15% of consumers who plan to increase their spending this holiday season, 42% say it’s only because inflation is driving prices up, and 37% say it’s because they plan to purchase gifts for more people.
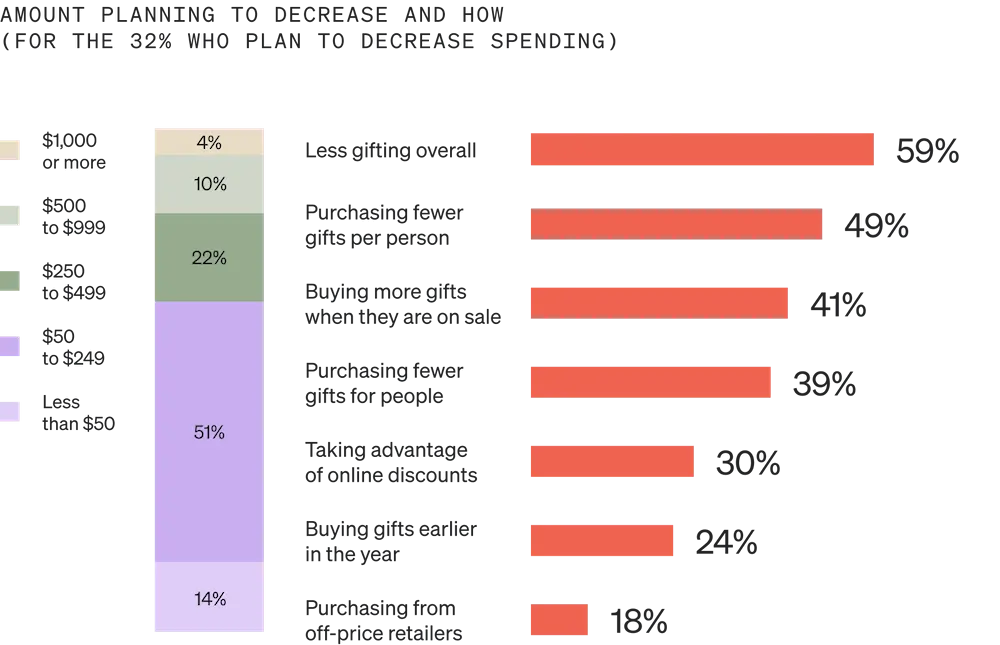
Of the 32% of consumers who plan to decrease their spending this holiday season, 59% plan to accomplish it by doing less gifting overall, while 49% plan to purchase fewer gifts per person.
How to apply these findings to your marketing: make saving easy—and fun
Fier offers several marketing strategies for appealing to consumers who are trying to save money this year:
- Bundles
- Gift card with purchase
- Free gift with purchase
- Triple or quadruple loyalty points days
- Flash sales
- Purchase to enter sweepstakes or contest
Regardless of the incentive, “given that the spend-apprehensive audience will skew older, we usually like to approach it with problem > solution language,” Fier explains.
Whether the consumer’s problem is saving money on gifts, avoiding sell-outs, or crossing something off their to-do list fast, try a messaging arc that moves from “Why us?” to “Your problem” to “Our solution,” Fier says: “There’s an angle for any brand.”
For consumers who are laser-focused on saving money this holiday season, Flaherty suggests using an approach he calls the “cruise ship jewelry selling methodology,” “which is quite similar to a reverse auction,” he says.
Given that the spend-apprehensive audience will skew older, we usually like to approach it with problem > solution language.
Here’s how it works: Each day, you give different products higher and higher discounts, with the highest discounts on the final day of the sale.
“You will need to be smart to avoid customers all waiting until the last day,” Flaherty warns. “By not letting them know about the scheduled deals, advertising limited availability, and leaving out-of-stock items on product listing pages, you instill a sense of urgency in the customer.”
Last but not least, “give those who do purchase early an additional discount code or free gift with purchase incentive to make another purchase later in the week,” Flaherty says.
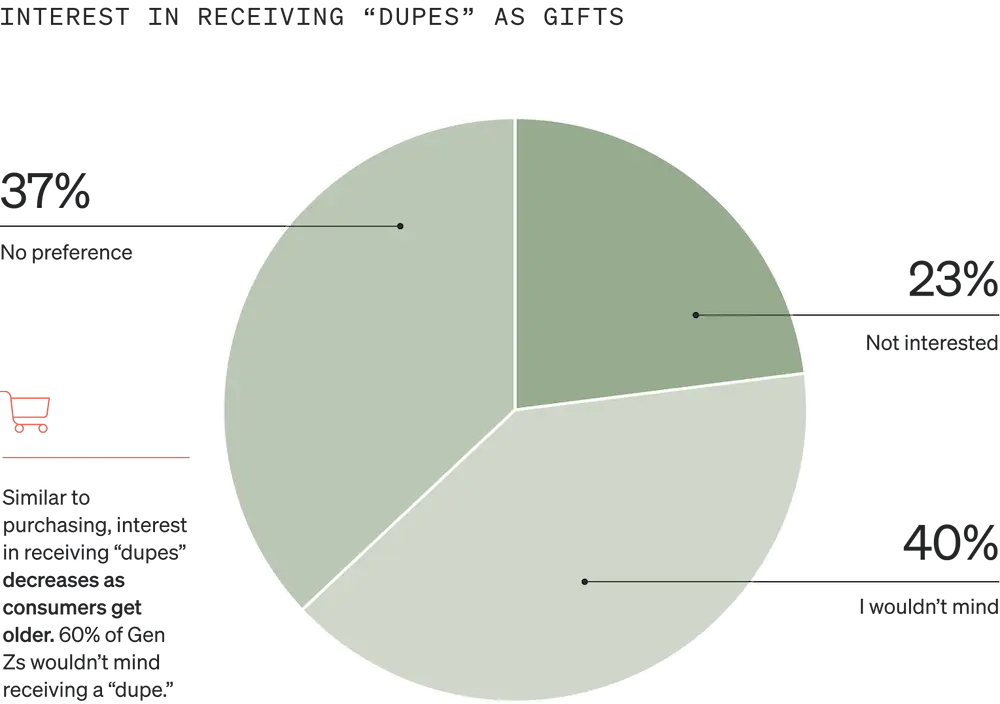
What: “dupes” are acceptable
Finally, for consumers looking for creative ways to keep up with the Joneses, “dupes”—products of similar quality from lesser-known brands—provide an affordable alternative to popular, high-ticket items.
No consumer wants to skimp on quality, especially when it comes to gifting. But while imitations of popular items used to be scorned as “knock-offs,” the survey findings reveal that “dupes” are becoming more and more socially acceptable—especially among younger generations.

Brands that cater their product offerings to echo some of the latest and greatest trends might earn business from shoppers this holiday season: Nearly half (40%) of consumers wouldn’t mind receiving a “dupe” as a gift—a proportion that increases the younger the individual. Well over half (60%) of Gen Zs are open to receiving “dupes” as gifts.
How to apply these findings to your marketing: convince them “the dupe is better”
For brands offering products similar to a high-end brand, Flaherty encourages trying a strategy he calls “The dupe is better.”
For example: “Their cup keeps coffee hot for 6 hours? Ours does 8 at the same price.” “Their camping tent is 23 ounces? Ours is 18 ounces at the same price.”
Don’t be afraid to address consumer objections head-on.
“In the buyer’s mind, this has an almost identical effect to the product actually costing less,” Flaherty points out. “Don’t be afraid to address consumer objections head-on.”
Intelligent, data-based marketing: the key to winning business this BFCM, no matter your audience
Let’s recap: Younger consumers, especially, are feeling confident and ready to spend more on discretionary purchases, little luxuries, and gifts this holiday season. But consumers are split on their feelings about the economy, and most are already feeling the effects of inflation on their spending habits.
“Given that younger audiences are more positive about the current economic climate, more likely to shop online, and more likely to spend on non-essentials, it is vital to be able to identify and segment these audiences using a platform like Klaviyo,” MacBeth says.
Given that younger audiences are more positive about the current economic climate, more likely to shop online, and more likely to spend on non-essentials, it is vital to be able to identify and segment these audiences using a platform like Klaviyo.
People aren’t all the same. Klaviyo gives marketers the integrations and functionality they need to power smarter digital relationships—regardless of their age, shopping preferences, or how much money they have to spend.
More than 100K ecommerce brands use Klaviyo to:
- Activate their data in real time to better target, personalize, and measure all their interactions
- Connect with customers through a seamless experience over email, SMS, reviews, and push notifications on mobile devices
- Guide their marketing with built-in AI, automations, predictive analytics, and benchmarks
- Grow their audience, their customer LTV, and their total revenue
“Leveraging Klaviyo CDP functionality allows marketers to better segment and activate campaigns in paid and owned channels,” MacBeth points out. “When done correctly, return on ad spend (ROAS) and profitability will improve—a requirement when consumer fears about the economy drag down purchase activity.”
Faced with low opinions about the economy, consumer hesitancy around buying non-essentials, and a 2x preference for online shopping, marketers should “focus on executing the basics, better,” says Gary Penn, ecommerce practice consultant at Chameleon Collective.
Leveraging Klaviyo CDP functionality allows marketers to better segment and activate campaigns in paid and owned channels. When done correctly, ROAS and profitability will improve—a requirement when consumer fears about the economy drag down purchase activity.
“Automate and simplify to reduce friction in your service touchpoints. Set up killer triggered email campaigns with updated content and fantastic cross-selling opportunities,” Penn suggests. “And not just post-purchase, but bounce-back and win-back and lost souls—build them all.”
“Check your go-to-market, align cross-functional communications well in advance, build out your holiday ‘gap closer’ promotional Plan B, and buckle your seatbelt,” Penn adds. “This is why you do this. Go rock ’n’ roll.”
Do more with your data with Klaviyo.
Get a demoBlack Friday statistics FAQs
Are Black Friday statistics different for brick-and-mortar stores vs. online-only businesses?
It depends on the kind of statistics you’re talking about. According to our findings, for example, half (50%) of consumers plan to shop primarily online this holiday season, compared to only 18% who plan to shop primarily in-store—which leaves 32% who plan to shop equally online and in-store for the holidays. But regardless of where they’re spending their money, consumers plan to spend an average of $745 on gifts.
How do I use the results of my Black Friday campaigns for forecasting?
First, determine the top marketing KPIs for your brand, such as open rate, click rate, revenue per recipient, placed order rate, list growth, unsubscribe rate, etc. Metrics like these demonstrate, in concrete numbers, the level of interest and engagement in your Black Friday email campaigns. When you assess these results, you gain a clearer understanding of what’s driving your marketing success—or lack thereof. Those insights can help you more accurately predict the future performance of not only your email marketing, but your business overall.
Can Black Friday customer data be used for off-season marketing?
It depends on the type of customer data. Although regulations like the GDPR and CTIA place strict limitations on how brands use third-party data in their marketing and advertising efforts, data your customers consent to sharing with you—also known as zero- and first-party data—is generally safe to use year-round, regardless of when you collect it. Just make sure you’re transparent with your customers about how you plan to use their data. For example, if you send a post-BFCM survey to collect product preferences so that you can provide more relevant communications in the future, state that clearly in your messaging.

Related content